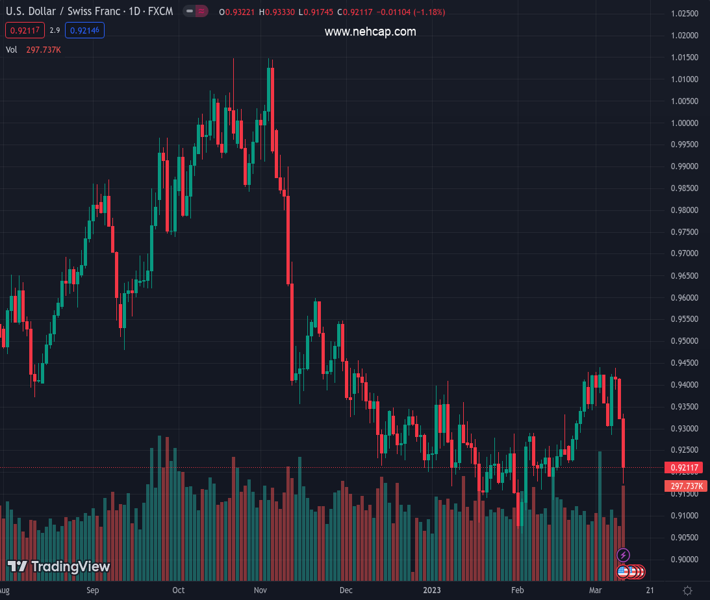
#USDCHF @ 0.92140 extended its drop past the 20/50-day EMAs after facing resistance at the 200-day EMA. (Pivot Orderbook analysis)
…
This is a premium post.
[s2If !current_user_can(access_s2member_level4)]Please register for PREMIUM VERSION HERE to read full post below containing analysis. In case of any error or you think you are not able to read the full post below, please email us at support#nehcap.com [lwa][/s2If] [s2If current_user_can(access_s2member_level4)]
- USD/CHF extended its drop past the 20/50-day EMAs after facing resistance at the 200-day EMA.
- USD/CHF Price Forecast: Shifted bearish, though needs to crack 0.9130s to test YTD lows.
The pair currently trades last at 0.92140.
The previous day high was 0.942 while the previous day low was 0.9338. The daily 38.2% Fib levels comes at 0.9369, expected to provide resistance. Similarly, the daily 61.8% fib level is at 0.9388, expected to provide resistance.
USD/CHF falls below the confluence of the 20 and 50-day Exponential Moving Averages (EMAs), extending its daily losses to more than 1% Friday. A mixed US jobs report weighed on the US Dollar (USD). Sentiment deteriorates on a US bank collapse, which could have spillover in the country. At the time of writing, the USD/CHF is trading at 0.9216.
After dropping below the intersection of the 20 and 50-day EMAs, the USD/CHF shifted downwards. During the day, the pair reached a multi-week low of around 0.9174 before buyers stepped in and lifted the price above the 0.9200 figure.
With the Relative Strength Index (RSI) turning bearish and the Rate of Change (RoC) showing that sellers are gathering momentum, the USD/CHF path of least resistance is downwards.
That said, the USD/CHF pair’s first support would be the 0.9200 figure. Once broken, the pair would test the March 10 low at 0.9174, followed by the February 14 swing low at 0.9140. A breach of the latter will expose the 0.9100 figure, followed by the YTD low at 0.9059.
In an alternate scenario, if the USD/CHF reclaims 0.9300, that would keep the bulls hopeful for testing the 0.9400 figure. However, buyers must conquer the 50 and 20-day EMAs at 0.9311 and 0.9319.
Technical Levels: Supports and Resistances
USDCHF currently trading at 0.9214 at the time of writing. Pair opened at 0.9339 and is trading with a change of -1.34 % .
| Overview | Overview.1 | |
|---|---|---|
| 0 | Today last price | 0.9214 |
| 1 | Today Daily Change | -0.0125 |
| 2 | Today Daily Change % | -1.3400 |
| 3 | Today daily open | 0.9339 |
The pair remains strongly bearish on the daily time frame. It trades below the 20 SMA @ 0.932, 50 SMA 0.9267, 100 SMA @ 0.941 and 200 SMA @ 0.9563.
| Trends | Trends.1 | |
|---|---|---|
| 0 | Daily SMA20 | 0.9320 |
| 1 | Daily SMA50 | 0.9267 |
| 2 | Daily SMA100 | 0.9410 |
| 3 | Daily SMA200 | 0.9563 |
The previous day high was 0.942 while the previous day low was 0.9338. The daily 38.2% Fib levels comes at 0.9369, expected to provide resistance. Similarly, the daily 61.8% fib level is at 0.9388, expected to provide resistance.
Note the levels of interest below:
- Pivot support is noted at 0.9311, 0.9284, 0.923
- Pivot resistance is noted at 0.9393, 0.9447, 0.9475
| Levels | Levels.1 |
|---|---|
| Previous Daily High | 0.9420 |
| Previous Daily Low | 0.9338 |
| Previous Weekly High | 0.9440 |
| Previous Weekly Low | 0.9342 |
| Previous Monthly High | 0.9429 |
| Previous Monthly Low | 0.9059 |
| Daily Fibonacci 38.2% | 0.9369 |
| Daily Fibonacci 61.8% | 0.9388 |
| Daily Pivot Point S1 | 0.9311 |
| Daily Pivot Point S2 | 0.9284 |
| Daily Pivot Point S3 | 0.9230 |
| Daily Pivot Point R1 | 0.9393 |
| Daily Pivot Point R2 | 0.9447 |
| Daily Pivot Point R3 | 0.9475 |
[/s2If]
Join Our Telegram Group
")


