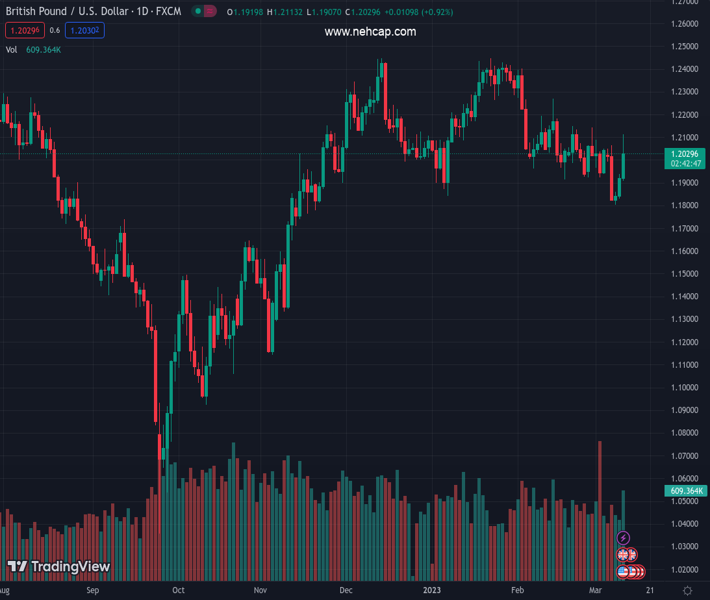
#GBPUSD @ 1.20330 rallied almost 1% or 114 pips on Friday, post US NFP. (Pivot Orderbook analysis)
…
This is a premium post.
[s2If !current_user_can(access_s2member_level4)]Please register for PREMIUM VERSION HERE to read full post below containing analysis. In case of any error or you think you are not able to read the full post below, please email us at support#nehcap.com [lwa][/s2If] [s2If current_user_can(access_s2member_level4)]
- GBP/USD rallied almost 1% or 114 pips on Friday, post US NFP.
- Bulls struggle at the 200-day EMA, exacerbating a GBP/USD fall of 60 pips to current rates.
- GBP/USD Price Analysis: The bias is bearish, but upside risks remain.
The pair currently trades last at 1.20330.
The previous day high was 1.1939 while the previous day low was 1.1832. The daily 38.2% Fib levels comes at 1.1898, expected to provide support. Similarly, the daily 61.8% fib level is at 1.1873, expected to provide support.
GBP/USD recovers some ground getting ready to finish the week with minimal gains after bouncing off YTD lows at 1.1802, with buyers reclaiming 1.2000 on a mixed US jobs report. At the time of writing, the GBP/USD is trading at 1.2040, above its opening price y 1.01%.
The GBP/USD has reclaimed the 1.2000 figure, but its bias has not changed. The aftermath of the US Nonfarm Payrolls report witnessed the Pound Sterling (GBP) reaching the 200-day Exponential Moving Average (EMA) at 1.2112. However, sellers stepped in and dragged the spot beneath the 1.2100 mark.
On its way south, the GBP/USD pierced under the 50-day EMA, leaving the exchange rates around familiar levels. Nevertheless, the 100 and 20-day EMAs are resting below the current prices, warranting further consolidation ahead.
For a bearish resumption, the GBP/USD needs to crack the 100 and 20-day EMAs, each at 1.2023 and 1.2010, respectively. After that, the 1,2000 figure could be grabbed, paving the way for further downside. The following support would be the 1.1900 figure, ahead of the YTD low at 1.1802.
Conversely, the GBP/USD must reclaim the 50-day EMA at 1.2056 if buyers want to remain hopeful of shifting the trend. The next resistance would be 1.2100, followed by the 200-day EMA at 1.2112.
Technical Levels: Supports and Resistances
GBPUSD currently trading at 1.204 at the time of writing. Pair opened at 1.1919 and is trading with a change of 1.02 % .
| Overview | Overview.1 | |
|---|---|---|
| 0 | Today last price | 1.2040 |
| 1 | Today Daily Change | 0.0121 |
| 2 | Today Daily Change % | 1.0200 |
| 3 | Today daily open | 1.1919 |
The pair is trading above its 20 Daily moving average @ 1.2015, below its 50 Daily moving average @ 1.213 , above its 100 Daily moving average @ 1.201 and above its 200 Daily moving average @ 1.1903
| Trends | Trends.1 | |
|---|---|---|
| 0 | Daily SMA20 | 1.2015 |
| 1 | Daily SMA50 | 1.2130 |
| 2 | Daily SMA100 | 1.2010 |
| 3 | Daily SMA200 | 1.1903 |
The previous day high was 1.1939 while the previous day low was 1.1832. The daily 38.2% Fib levels comes at 1.1898, expected to provide support. Similarly, the daily 61.8% fib level is at 1.1873, expected to provide support.
Note the levels of interest below:
- Pivot support is noted at 1.1854, 1.179, 1.1747
- Pivot resistance is noted at 1.1961, 1.2003, 1.2068
| Levels | Levels.1 |
|---|---|
| Previous Daily High | 1.1939 |
| Previous Daily Low | 1.1832 |
| Previous Weekly High | 1.2143 |
| Previous Weekly Low | 1.1922 |
| Previous Monthly High | 1.2402 |
| Previous Monthly Low | 1.1915 |
| Daily Fibonacci 38.2% | 1.1898 |
| Daily Fibonacci 61.8% | 1.1873 |
| Daily Pivot Point S1 | 1.1854 |
| Daily Pivot Point S2 | 1.1790 |
| Daily Pivot Point S3 | 1.1747 |
| Daily Pivot Point R1 | 1.1961 |
| Daily Pivot Point R2 | 1.2003 |
| Daily Pivot Point R3 | 1.2068 |
[/s2If]
Join Our Telegram Group
")


