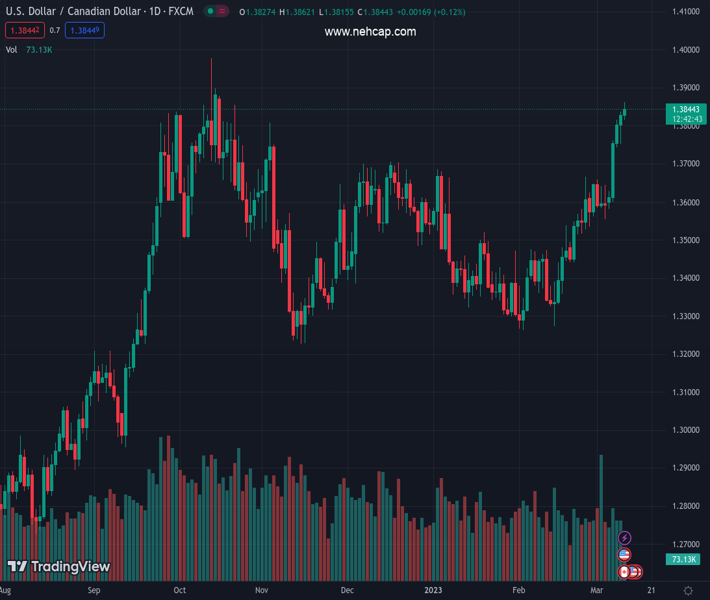
#USDCAD @ 1.38473 continues scaling higher on Friday and touches its highest level since October. (Pivot Orderbook analysis)
…
This is a premium post.
[s2If !current_user_can(access_s2member_level4)]Please register for PREMIUM VERSION HERE to read full post below containing analysis. In case of any error or you think you are not able to read the full post below, please email us at support#nehcap.com [lwa][/s2If] [s2If current_user_can(access_s2member_level4)]
- USD/CAD continues scaling higher on Friday and touches its highest level since October.
- Bearish crude Oil prices undermine the Loonie and remain supportive of the momentum.
- The risk-off mood benefits the USD’s relative safe-haven status and acts as a tailwind.
- Traders now look to the monthly jobs data from Canada and the US for a fresh impetus.
The pair currently trades last at 1.38473.
The previous day high was 1.3837 while the previous day low was 1.3753. The daily 38.2% Fib levels comes at 1.3805, expected to provide support. Similarly, the daily 61.8% fib level is at 1.3785, expected to provide support.
The USD/CAD pair adds to its strong weekly gains and climbs to its highest level since October 17, 2022, around the 1.3860 area during the first half of the European session on Friday.
The selling pressure around Crude Oil prices remains unabated for the fourth straight day, which undermines the commodity-linked Loonie and acts as a tailwind for the USD/CAD pair. In fact, the black liquid remains on track to register its worst fall since early February amid worries that slowing global economic growth will dent fuel demand. Apart from this, the fact that the Bank of Canada (BoC) became the first major central bank to pause its rate-hiking cycle on Wednesday is seen as another factor weighing on the Canadian Dollar.
The aforementioned factors, to a larger extent, helps offset a modest US Dollar weakness and continue to push the USD/CAD pair higher. Data released on Thursday showed a larger-than-expected rise in the US Weekly Jobless Claims, which was seen as the first sign of a softening labor market. This, in turn, forced investors to re-evaluate the possibility of a 50 bps lift-off at the upcoming FOMC meeting on March 21-22, leading to a further decline in the US Treasury bond yields and exerting some follow-through pressure on the Greenback.
That said, the prevalent risk-off environment – amid looming recession risks – helps limit losses for the safe-haven buck, at least for the time being. The market sentiment remains fragile in the wake of worries about economic headwinds stemming from rising borrowing costs, which is reinforced by a further deepening of the yield curve. Adding to this, the incoming softer Chinese macro data dashed hopes for a strong recovery in the world’s second-largest economy. This, in turn, tempers investors’ appetite for perceived riskier assets.
The USD/CAD bulls, meanwhile, might prefer to take a breather amid a slightly overbought Relative Strength Index (RSO) on the daily chart and ahead of the closely-watched US monthly employment details. The popularly known NFP report is more likely to overshadow the Canadian jobs data and play a key role in influencing the pair’s near-term trajectory. The focus will then shift to the latest US consumer inflation figures, due for release next Tuesday.
Technical Levels: Supports and Resistances
USDCAD currently trading at 1.3858 at the time of writing. Pair opened at 1.3833 and is trading with a change of 0.18 % .
| Overview | Overview.1 | |
|---|---|---|
| 0 | Today last price | 1.3858 |
| 1 | Today Daily Change | 0.0025 |
| 2 | Today Daily Change % | 0.1800 |
| 3 | Today daily open | 1.3833 |
The pair remains strongly bullish on the daily timeframe. It trades above its 20 SMA @ 1.3552, 50 SMA 1.3474, 100 SMA @ 1.3502 and 200 SMA @ 1.3307.
| Trends | Trends.1 | |
|---|---|---|
| 0 | Daily SMA20 | 1.3552 |
| 1 | Daily SMA50 | 1.3474 |
| 2 | Daily SMA100 | 1.3502 |
| 3 | Daily SMA200 | 1.3307 |
The previous day high was 1.3837 while the previous day low was 1.3753. The daily 38.2% Fib levels comes at 1.3805, expected to provide support. Similarly, the daily 61.8% fib level is at 1.3785, expected to provide support.
Note the levels of interest below:
- Pivot support is noted at 1.3778, 1.3723, 1.3694
- Pivot resistance is noted at 1.3863, 1.3892, 1.3947
| Levels | Levels.1 |
|---|---|
| Previous Daily High | 1.3837 |
| Previous Daily Low | 1.3753 |
| Previous Weekly High | 1.3659 |
| Previous Weekly Low | 1.3534 |
| Previous Monthly High | 1.3666 |
| Previous Monthly Low | 1.3262 |
| Daily Fibonacci 38.2% | 1.3805 |
| Daily Fibonacci 61.8% | 1.3785 |
| Daily Pivot Point S1 | 1.3778 |
| Daily Pivot Point S2 | 1.3723 |
| Daily Pivot Point S3 | 1.3694 |
| Daily Pivot Point R1 | 1.3863 |
| Daily Pivot Point R2 | 1.3892 |
| Daily Pivot Point R3 | 1.3947 |
[/s2If]
Join Our Telegram Group


