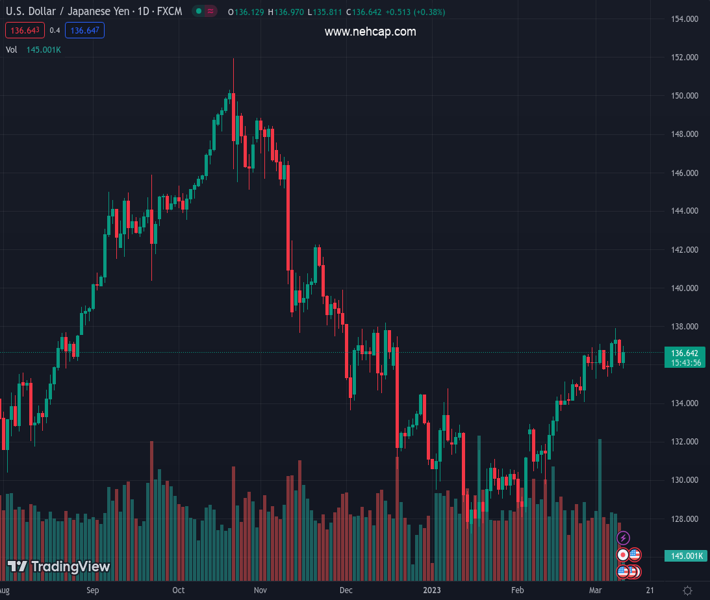
#USDJPY @ 136.658 has turned sideways around 136.65 as investors await US NFP for further guidance. (Pivot Orderbook analysis)
…
This is a premium post.
[s2If !current_user_can(access_s2member_level4)]Please register for PREMIUM VERSION HERE to read full post below containing analysis. In case of any error or you think you are not able to read the full post below, please email us at support#nehcap.com [lwa][/s2If] [s2If current_user_can(access_s2member_level4)]
- USD/JPY has turned sideways around 136.65 as investors await US NFP for further guidance.
- BoJ Kuroda continued expansionary monetary policy as the domestic demand and wages have failed to spur inflation.
- The RSI (14) is gathering strength for shifting into the bullish range of 60.00-80.00.
The pair currently trades last at 136.658.
The previous day high was 137.44 while the previous day low was 135.94. The daily 38.2% Fib levels comes at 136.51, expected to provide support. Similarly, the daily 61.8% fib level is at 136.86, expected to provide resistance.
The USD/JPY pair is displaying a volatility contraction around 136.65 after sheer volatility inspired by the continuation of an ultra-easy monetary policy by the Bank of Japan (BoJ). BoJ Governor Haruhiko Kuroda continued expansionary monetary policy as the domestic demand and wages have failed to spurt inflation in the Japanese economy.
The US Dollar Index (DXY) is gathering strength in extending its recovery above the immediate resistance of 105.35. The USD Index has been extremely quiet as investors are awaiting the release of the United States Nonfarm Payrolls (NFP) data. S&P500 futures are continuously accelerating losses as fears of aggressive interest rates by the Federal Reserve (Fed) are skyrocketing.
Meanwhile, the demand for US government bonds is soaring, which has trimmed the 10-year US Treasury yields further below 3.82%.
On an hourly scale, USD/JPY has rebounded firmly from the upward-sloping trendline plotted from March 06 low at 135.37. The asset has extended its recovery above the critical resistance of 136.45, which has turned into support for the US Dollar bulls.
The recovery move in the USD/JPY looks full of strength as the asset has scaled above the 20-and 50-period Exponential Moving Averages (EMAs) at 136.40 and 136.55 respectively.
Meanwhile, the Relative Strength Index (RSI) (14) is making efforts in shifting into the bullish range of 60.00-80.00. An occurrence of the same will trigger the upside momentum.
Going forward, a break above the intraday high at 137.00 will drive the asset toward March 08 high at 137.90 followed by November 28 high at 139.43.
Alternatively, a downside move below the intraday low at 135.82 will drag the asset toward March 01 low at 135.26. A slippage below the latter will expose the asset to February 24 low at 134.06.
Technical Levels: Supports and Resistances
USDJPY currently trading at 136.64 at the time of writing. Pair opened at 136.11 and is trading with a change of 0.39 % .
| Overview | Overview.1 | |
|---|---|---|
| 0 | Today last price | 136.64 |
| 1 | Today Daily Change | 0.53 |
| 2 | Today Daily Change % | 0.39 |
| 3 | Today daily open | 136.11 |
The pair is trading above its 20 Daily moving average @ 135.08, above its 50 Daily moving average @ 132.33 , above its 100 Daily moving average @ 136.11 and below its 200 Daily moving average @ 137.46
| Trends | Trends.1 | |
|---|---|---|
| 0 | Daily SMA20 | 135.08 |
| 1 | Daily SMA50 | 132.33 |
| 2 | Daily SMA100 | 136.11 |
| 3 | Daily SMA200 | 137.46 |
The previous day high was 137.44 while the previous day low was 135.94. The daily 38.2% Fib levels comes at 136.51, expected to provide support. Similarly, the daily 61.8% fib level is at 136.86, expected to provide resistance.
Note the levels of interest below:
- Pivot support is noted at 135.56, 135.0, 134.06
- Pivot resistance is noted at 137.05, 137.99, 138.55
| Levels | Levels.1 |
|---|---|
| Previous Daily High | 137.44 |
| Previous Daily Low | 135.94 |
| Previous Weekly High | 137.10 |
| Previous Weekly Low | 135.26 |
| Previous Monthly High | 136.92 |
| Previous Monthly Low | 128.08 |
| Daily Fibonacci 38.2% | 136.51 |
| Daily Fibonacci 61.8% | 136.86 |
| Daily Pivot Point S1 | 135.56 |
| Daily Pivot Point S2 | 135.00 |
| Daily Pivot Point S3 | 134.06 |
| Daily Pivot Point R1 | 137.05 |
| Daily Pivot Point R2 | 137.99 |
| Daily Pivot Point R3 | 138.55 |
[/s2If]
Join Our Telegram Group


