#XAUUSD @ 1,829.12 Gold price takes offers to refresh intraday low, pares the biggest daily gain in a week amid volatile session., @nehcap view: Further downside expected (Pivot Orderbook analysis)
…
This is a premium post.
[s2If !current_user_can(access_s2member_level4)]Please register for PREMIUM VERSION HERE to read full post below containing analysis. In case of any error or you think you are not able to read the full post below, please email us at support#nehcap.com [lwa][/s2If] [s2If current_user_can(access_s2member_level4)]
- Gold price takes offers to refresh intraday low, pares the biggest daily gain in a week amid volatile session.
- BoJ inaction fails to tame market’s fears amid inflation concerns.
- Geopolitical woes, US Dollar’s rebound from intraday low also weigh on XAU/USD price.
- Key central bank announcements, US employment data for February will be the key for fresh impulse.
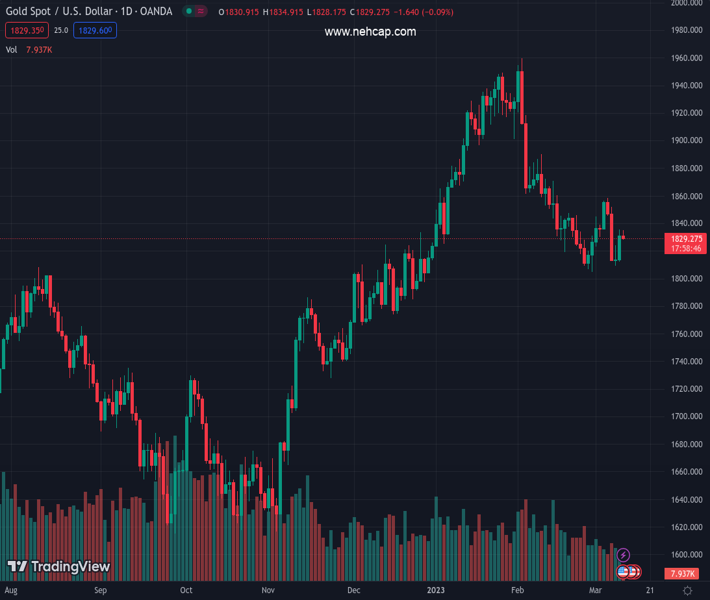
The pair currently trades last at 1829.12.
The previous day high was 1835.67 while the previous day low was 1812.02. The daily 38.2% Fib levels comes at 1826.64, expected to provide support. Similarly, the daily 61.8% fib level is at 1821.05, expected to provide support.
Gold price (XAU/USD) remains pressured around the intraday bottom near $1,828 as markets brace for the US jobs report, after witnessing a haywire move on the Bank of Japan’s inaction, during early Friday. It’s worth noting that the precious metal’s latest weakness appears more linked to the risk-off mood than to the US Treasury bond yield and the US Dollar as both these catalysts are in the red zone, despite bouncing off recently.
While talking about the sentiment, BoJ highlights inflation fears and joins the New York Fed to challenge the policy doves, suggesting more rate hikes and question the economic growth, which in turn tease Gold sellers.
That said, the BoJ keeps the short-term interest rate target at -0.1% while directing 10-year Japanese Government Bond (JGB) yields within the band of +/-0.50%.
On the other hand, New York Fed mentioned, in its latest report, that recent upward revisions to inflation data coupled with higher-than-expected levels of inflation had changed the picture of what had appeared to be cooling in price pressures.
It should be observed that the previous day’s mixed signals of the US employment data allowed the US Dollar to remain weak, which in turn seemed to have put a floor under the Gold price.
Also positive for the Gold price could be a news piece from Bloomberg suggesting that China’s consumer spending is showing signs of a strong rebound joining the hopes of more stimulus from the dragon nation and the US readiness for more spending.
However, the latest risk-off mood and cautious sentiment ahead of the Nonfarm Payrolls (NFP) join the geopolitical fears to weigh on sentiment. Among them, US President Joe Biden’s budget proposal for 2024 and the US partnership with the UK and Australia for nuclear submarines weigh on the risk appetite and the XAU/USD.
Looking ahead, the US jobs report for February will be observed closely as traders have recently curtailed the market’s bets on the 50 bps rate hike in March.
Also read: Nonfarm Payrolls Preview: Five scenarios for the Fed, USD and stocks reactions, with probabilities
Gold price slides within a one-week-old symmetrical triangle, recently easing from the resistance line amid an impending bear cross on the MACD. It’s worth noting that the RSI’s retreat from the overbought territory also exerts downside pressure on the XAU/USD price that aims for the 100-bar Exponential Moving Average (EMA), around $1,827 at the latest.
However, a broad support area between $1,820 and $1,823, comprising multiple levels marked since late February, appears a tough nut to crack for the Gold sellers afterward.
Should the XAU/USD price remains weak past $1,820, an upward-sloping support line from February, forming part of the aforementioned triangle, could act as the last defense of the Gold buyers near $1,810.
Meanwhile, an upside clearance of the stated triangle’s top line, close to $1,835 at the latest, could propel the Gold price towards the month-start peak surrounding $1,845. Following that, the monthly high of nearly $1,859 will be in the spotlight.
Overall, Gold price signals further downside but the room towards the south appears limited.
Trend: Further downside expected
Technical Levels: Supports and Resistances
XAUUSD currently trading at 1828.69 at the time of writing. Pair opened at 1830.62 and is trading with a change of -0.11% % .
| Overview | Overview.1 | |
|---|---|---|
| 0 | Today last price | 1828.69 |
| 1 | Today Daily Change | -1.93 |
| 2 | Today Daily Change % | -0.11% |
| 3 | Today daily open | 1830.62 |
The pair is trading below its 20 Daily moving average @ 1835.2, below its 50 Daily moving average @ 1870.14 , above its 100 Daily moving average @ 1808.33 and above its 200 Daily moving average @ 1774.97
| Trends | Trends.1 | |
|---|---|---|
| 0 | Daily SMA20 | 1835.20 |
| 1 | Daily SMA50 | 1870.14 |
| 2 | Daily SMA100 | 1808.33 |
| 3 | Daily SMA200 | 1774.97 |
The previous day high was 1835.67 while the previous day low was 1812.02. The daily 38.2% Fib levels comes at 1826.64, expected to provide support. Similarly, the daily 61.8% fib level is at 1821.05, expected to provide support.
Note the levels of interest below:
- Pivot support is noted at 1816.54, 1802.45, 1792.89
- Pivot resistance is noted at 1840.19, 1849.75, 1863.84
| Levels | Levels.1 |
|---|---|
| Previous Daily High | 1835.67 |
| Previous Daily Low | 1812.02 |
| Previous Weekly High | 1856.35 |
| Previous Weekly Low | 1804.76 |
| Previous Monthly High | 1959.80 |
| Previous Monthly Low | 1804.76 |
| Daily Fibonacci 38.2% | 1826.64 |
| Daily Fibonacci 61.8% | 1821.05 |
| Daily Pivot Point S1 | 1816.54 |
| Daily Pivot Point S2 | 1802.45 |
| Daily Pivot Point S3 | 1792.89 |
| Daily Pivot Point R1 | 1840.19 |
| Daily Pivot Point R2 | 1849.75 |
| Daily Pivot Point R3 | 1863.84 |
[/s2If]
Join Our Telegram Group


