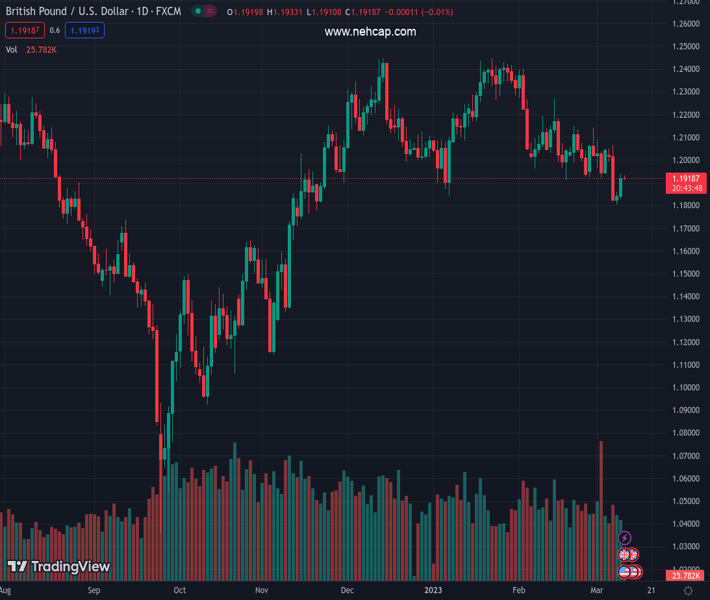
#GBPUSD @ 1.19218 is aiming to recapture the immediate resistance of 1.1950 as USD Index has extended losses. (Pivot Orderbook analysis)
…
This is a premium post.
[s2If !current_user_can(access_s2member_level4)]Please register for PREMIUM VERSION HERE to read full post below containing analysis. In case of any error or you think you are not able to read the full post below, please email us at support#nehcap.com [lwa][/s2If] [s2If current_user_can(access_s2member_level4)]
- GBP/USD is aiming to recapture the immediate resistance of 1.1950 as USD Index has extended losses.
- Investors have started shrugging off volatility associated with aggressive Fed rate hike bets.
- A continuation of the UK’s manufacturing sector contraction might force the BoE to consider a steady monetary policy.
The pair currently trades last at 1.19218.
The previous day high was 1.1939 while the previous day low was 1.1832. The daily 38.2% Fib levels comes at 1.1898, expected to provide support. Similarly, the daily 61.8% fib level is at 1.1873, expected to provide support.
The GBP/USD pair has comfortably shifted its business above 1.1950 in the Asian session. The Cable is looking to stretch its recovery towards 1.1950 amid the absence of sheer anxiety among investors for the United States Nonfarm Payrolls (NFP) release. Also, investors have started shrugging off volatility associated with aggressive Fed rate hike bets. Investors understand the fact that higher inflation could be tamed by restrictive measures from the Fed, therefore, more rates from the Fed are a reality.
S&P500 futures have extended their losses in the Asian session after a nosedive Thursday where investors were discouraged by higher taxes on corporations, billionaires, and rich investors. Higher taxes on corporations will trim their Net Profit margins and investors would get reduced dividends on their investments.
The US Dollar Index (DXY) has dropped below Thursday’s low at 105.13 on hopes that the US labor market is not solid now as considered earlier. An 11% jump in Initial Jobless Claims and four-fold planned lay-offs by US firms are indicating that the US labor market could decelerate ahead. This might compel the Fed to continue its moderate pace for hiking rates further.
However, the release of the US NFP will be of utmost importance to the market. As per the projections, the US economy has recorded a jump in the number of payrolls by 203K in February. The Unemployment Rate is seen unchanged at 3.4%.
On the Pound Sterling front, Manufacturing sector data will be keenly watched. Monthly Manufacturing production (Jan) and Industrial Production are expected to contract by 0.1% and 0.2% respectively.
Investors should be aware of the fact that the performance of the UK manufacturing sector has remained vulnerable in the past few months. This could force the Bank of England (BoE) to pause the policy-tightening process for the time being and allow current monetary policy to show its impact.
Technical Levels: Supports and Resistances
GBPUSD currently trading at 1.193 at the time of writing. Pair opened at 1.1919 and is trading with a change of 0.09 % .
| Overview | Overview.1 | |
|---|---|---|
| 0 | Today last price | 1.1930 |
| 1 | Today Daily Change | 0.0011 |
| 2 | Today Daily Change % | 0.0900 |
| 3 | Today daily open | 1.1919 |
The pair is trading below its 20 Daily moving average @ 1.2015, below its 50 Daily moving average @ 1.213 , below its 100 Daily moving average @ 1.201 and above its 200 Daily moving average @ 1.1903
| Trends | Trends.1 | |
|---|---|---|
| 0 | Daily SMA20 | 1.2015 |
| 1 | Daily SMA50 | 1.2130 |
| 2 | Daily SMA100 | 1.2010 |
| 3 | Daily SMA200 | 1.1903 |
The previous day high was 1.1939 while the previous day low was 1.1832. The daily 38.2% Fib levels comes at 1.1898, expected to provide support. Similarly, the daily 61.8% fib level is at 1.1873, expected to provide support.
Note the levels of interest below:
- Pivot support is noted at 1.1854, 1.179, 1.1747
- Pivot resistance is noted at 1.1961, 1.2003, 1.2068
| Levels | Levels.1 |
|---|---|
| Previous Daily High | 1.1939 |
| Previous Daily Low | 1.1832 |
| Previous Weekly High | 1.2143 |
| Previous Weekly Low | 1.1922 |
| Previous Monthly High | 1.2402 |
| Previous Monthly Low | 1.1915 |
| Daily Fibonacci 38.2% | 1.1898 |
| Daily Fibonacci 61.8% | 1.1873 |
| Daily Pivot Point S1 | 1.1854 |
| Daily Pivot Point S2 | 1.1790 |
| Daily Pivot Point S3 | 1.1747 |
| Daily Pivot Point R1 | 1.1961 |
| Daily Pivot Point R2 | 1.2003 |
| Daily Pivot Point R3 | 1.2068 |
[/s2If]
Join Our Telegram Group


