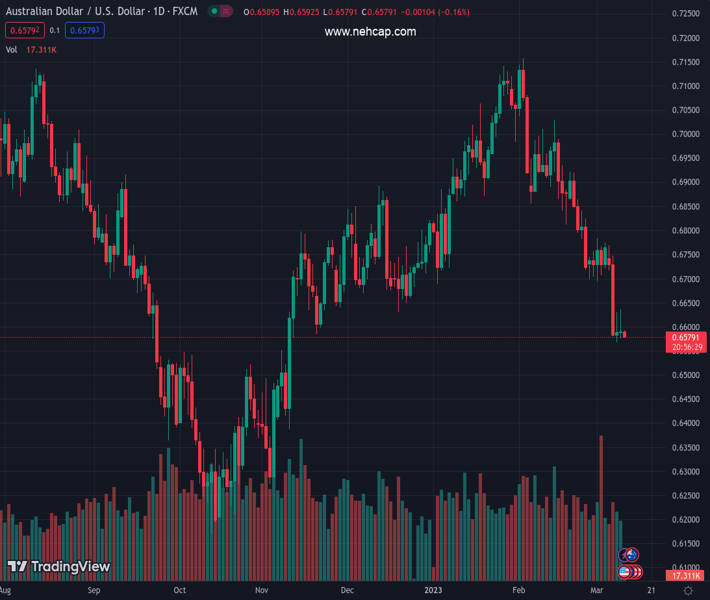
#AUDUSD @ 0.65809 looks vulnerable around 0.6580 as USD Index is building a cushion around 105.20. (Pivot Orderbook analysis)
…
This is a premium post.
[s2If !current_user_can(access_s2member_level4)]Please register for PREMIUM VERSION HERE to read full post below containing analysis. In case of any error or you think you are not able to read the full post below, please email us at support#nehcap.com [lwa][/s2If] [s2If current_user_can(access_s2member_level4)]
- AUD/USD looks vulnerable around 0.6580 as USD Index is building a cushion around 105.20.
- An Inverted Flag formation favors downside bias for the Aussie asset.
- The RSI (14) has slipped into the bearish range of 20.00-40.00, which indicates that the downside momentum has been triggered.
The pair currently trades last at 0.65809.
The previous day high was 0.6636 while the previous day low was 0.6576. The daily 38.2% Fib levels comes at 0.6599, expected to provide resistance. Similarly, the daily 61.8% fib level is at 0.6613, expected to provide resistance.
The AUD/USD pair has delivered a less-confident rebound to near 0.6580 in the Asian session. The Aussie asset is navigating in a territory of 0.6580-0.6636 for the past two trading sessions. Investors should brace for sheer volatility as the release of the United States Nonfarm Payrolls (NFP) data will provide clear guidance.
The US Dollar Index (DXY) is building a cushion around 105.20 after a tad longer gradual correction. The release of the US NFP will trigger action moves as it will guide whether the Federal Reserve (Fed) will continue its moderate pace in hiking interest rates or will return to an aggressive rate hike approach.
Meanwhile, the Australian Dollar is expected to remain on tenterhooks as the Reserve Bank of Australia (RBA) has favored pausing policy-tightening ahead despite a one-time decline in the monthly Consumer Price Index (CPI).
AUD/USD is hovering near the edge of the Inverted Flag chart pattern formed on an hourly scale. An Inverted Flag is a trend-following pattern that displays a long consolidation that is followed by a breakdown. Usually, the consolidation phase of the chart pattern serves as an inventory adjustment in which those participants initiate shorts, which prefer to enter an auction after the establishment of a bearish bias.
The 20-period Exponential Moving Average (EMA) at 0.6600 is acting as a major barricade for the Australian Dollar.
Meanwhile, the Relative Strength Index (RSI) (14) has slipped into the bearish range of 20.00-40.00, which indicates that the downside momentum has been triggered.
Going forward, a breakdown of Wednesday’s low at 0.6568 will drag the asset toward the horizontal support plotted from October 4 high at 0.6547 followed by the round-level support at 0.6500.
In an alternate scenario, a break above Wednesday’s high at 0.6629 will push the Aussie asset toward December 22 low at 0.6650. A break above the same might expose the major to February 27 low near 0.6700.
Technical Levels: Supports and Resistances
AUDUSD currently trading at 0.6585 at the time of writing. Pair opened at 0.6588 and is trading with a change of -0.05 % .
| Overview | Overview.1 | |
|---|---|---|
| 0 | Today last price | 0.6585 |
| 1 | Today Daily Change | -0.0003 |
| 2 | Today Daily Change % | -0.0500 |
| 3 | Today daily open | 0.6588 |
The pair remains strongly bearish on the daily time frame. It trades below the 20 SMA @ 0.6794, 50 SMA 0.6889, 100 SMA @ 0.6763 and 200 SMA @ 0.678.
| Trends | Trends.1 | |
|---|---|---|
| 0 | Daily SMA20 | 0.6794 |
| 1 | Daily SMA50 | 0.6889 |
| 2 | Daily SMA100 | 0.6763 |
| 3 | Daily SMA200 | 0.6780 |
The previous day high was 0.6636 while the previous day low was 0.6576. The daily 38.2% Fib levels comes at 0.6599, expected to provide resistance. Similarly, the daily 61.8% fib level is at 0.6613, expected to provide resistance.
Note the levels of interest below:
- Pivot support is noted at 0.6564, 0.654, 0.6504
- Pivot resistance is noted at 0.6624, 0.666, 0.6684
| Levels | Levels.1 |
|---|---|
| Previous Daily High | 0.6636 |
| Previous Daily Low | 0.6576 |
| Previous Weekly High | 0.6784 |
| Previous Weekly Low | 0.6695 |
| Previous Monthly High | 0.7158 |
| Previous Monthly Low | 0.6698 |
| Daily Fibonacci 38.2% | 0.6599 |
| Daily Fibonacci 61.8% | 0.6613 |
| Daily Pivot Point S1 | 0.6564 |
| Daily Pivot Point S2 | 0.6540 |
| Daily Pivot Point S3 | 0.6504 |
| Daily Pivot Point R1 | 0.6624 |
| Daily Pivot Point R2 | 0.6660 |
| Daily Pivot Point R3 | 0.6684 |
[/s2If]
Join Our Telegram Group


