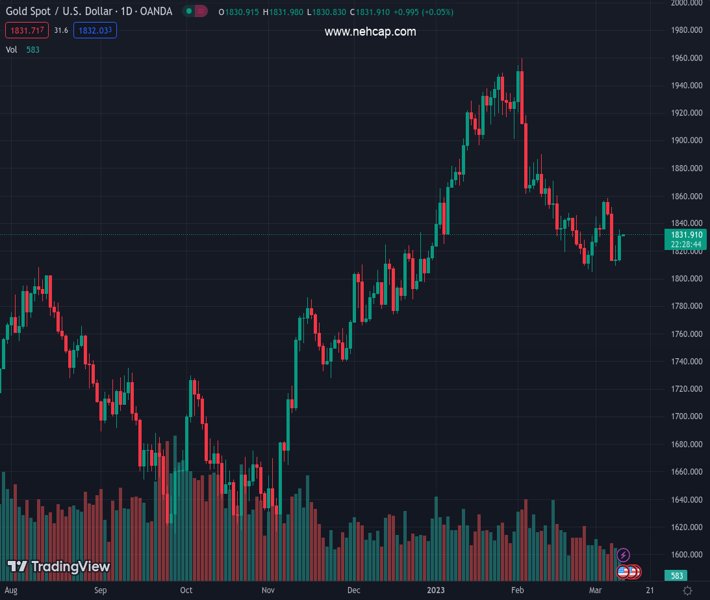
#XAUUSD @ 1,831.34 Gold price pares weekly losses by grinding higher, sidelined of late., @nehcap view: Limited upside expected (Pivot Orderbook analysis)
…
This is a premium post.
[s2If !current_user_can(access_s2member_level4)]Please register for PREMIUM VERSION HERE to read full post below containing analysis. In case of any error or you think you are not able to read the full post below, please email us at support#nehcap.com [lwa][/s2If] [s2If current_user_can(access_s2member_level4)]
- Gold price pares weekly losses by grinding higher, sidelined of late.
- United States Treasury bond yields retreat amid mixed clues for Nonfarm Payrolls (NFP) and challenge XAU/USD traders of late.
- Fears emanating from China, US President Biden’s budget proposal cap Gold prices amid pre-data anxiety.
- Downbeat NFP forecasts tease positive surprise and XAU/USD decline despite likely comparative deterioration in the actual figures.
The pair currently trades last at 1831.34.
The previous day high was 1824.33 while the previous day low was 1809.46. The daily 38.2% Fib levels comes at 1815.14, expected to provide support. Similarly, the daily 61.8% fib level is at 1818.65, expected to provide support.
Gold price (XAU/USD) portrays the typical pre-data caution as it seesaws around the $1,830 resistance confluence during early Friday, following the biggest daily run-up in a week. Apart from the XAU/USD trader’s anxiety ahead of the United States employment data for February, challenges to sentiment and doubts on the latest retreat in the US Treasury bond yields also probe the bullion buyers of late.
Gold price cheered mixed prints of the second-tier United States employment data and a pullback in the US Treasury bond yields to print the biggest daily jump in a week that pokes the short-term key resistance around $1,831.
On Wednesday, the US ADP Employment Change rose to 242K in February versus 200K market forecasts and 119K prior (revised). Further, January JOLTS job openings were 10.8M, compared to an upwardly revised 11.2M prior and 10.6M market forecast.
On the same line, US Initial Jobless Claims rose to 211K for the week ended on March 03 versus 195K expected and 190K prior. Additionally, the Challenger Job Cuts were down and the Continuing Jobless Claims were up.
Overall, the early signals for Friday’s Nonfarm Payrolls (NFP) appear mixed. However, analysts’ estimations for the Nonfarm Payrolls (NFP) appear too low at 203K, versus 517K prior, which in turn raises expectations of a positive surprise. The same may help the Gold bears to return to the table if details surrounding the wage growth and Unemployment Rate also refrain from the pessimistic outcome.
Also read: US February Nonfarm Payrolls Preview: Analyzing Gold price’s reaction to NFP surprises
It should be noted that the US 10-year and two-year Treasury bond yields eased to 3.92% and 4.87% versus 5.08% and 4.01% daily open respectively on Thursday. With this, the 10-year coupons marked the biggest daily loss in a week while the two-year counterpart flashed the heaviest fall in two months. As a result, Wall Street benchmarks closed with more than 1.5% daily losses each whereas the US Dollar Index (DXY) managed to pare some of the daily losses by the end of Thursday but failed to ignore the biggest daily fall in a week.
Despite the latest lack of clarity in the markets due to the mixed United States data, the market’s bets on the Federal Reserve (Fed) remain hawkish, which in turn challenges the Gold buyers ahead of the key US data. On Wednesday, Federal Reserve Chairman Jerome Powell highlighted the data dependency while also signaling that they have underestimated the resilience of growth and inflation. The news defends the hawkish Fed bias as market players expected a 50 bps rate hike in March, versus 0.25% expected in the last week.
Apart from the United States data and Federal Reserve concerns, geopolitical headlines also challenge the Gold price recovery.
That said, disappointment from China’s monthly Consumer Price Index (CPI) and Producer Price Index (PPI) data for February dims the prospects of recovery in the world’s second-largest economy, as well as one of the biggest XAU/USD users.
On the same line could be the fears of higher taxes in the world’s biggest economy, the US, as well as the political chaos relating to it as US President Joe Biden proposes raising corporation tax to cut $3 trillion from the fiscal deficit over the next decade.
Gold price extends the mid-week rebound from a fortnight-old ascending support line as the bulls poke a convergence of 100 and 50 Simple Moving Averages (SMAs), around $1,831 by the press time.
Adding strength to the recovery movement is the Relative Strength Index (RSI) line, placed at 14, as it gradually rises from the oversold territory. Furthermore, the looming bull cross of the Moving Average Convergence and Divergence (MACD) indicator also keeps the XAU/USD buyers hopeful of overcoming the immediate $1,832 resistance confluence.
However, a downward-sloping trend line from early February, near $1,852 at the latest, acts as the key upside barrier for the Gold buyers to knock to retake control.
Meanwhile, a downside break of the aforementioned two-week-old support line, near $1,810 at the latest, puts a floor under the XAU/USD price.
Ina case where the Gold bears manage to conquer the stated key support trend line, the $1,800 threshold may test the fall targeting the 61.8% Fibonacci Expansion (FE) of the metal’s moves between early February and March 06, close to $1,787.
To sum up, Gold price appears picking up strength but the bulls are far from winning the driver’s seat.
Trend: Limited upside expected
Technical Levels: Supports and Resistances
XAUUSD currently trading at 1831.42 at the time of writing. Pair opened at 1813.44 and is trading with a change of 0.99% % .
| Overview | Overview.1 | |
|---|---|---|
| 0 | Today last price | 1831.42 |
| 1 | Today Daily Change | 17.98 |
| 2 | Today Daily Change % | 0.99% |
| 3 | Today daily open | 1813.44 |
The pair is trading below its 20 Daily moving average @ 1836.7, below its 50 Daily moving average @ 1869.82 , above its 100 Daily moving average @ 1806.3 and above its 200 Daily moving average @ 1775.16
| Trends | Trends.1 | |
|---|---|---|
| 0 | Daily SMA20 | 1836.70 |
| 1 | Daily SMA50 | 1869.82 |
| 2 | Daily SMA100 | 1806.30 |
| 3 | Daily SMA200 | 1775.16 |
The previous day high was 1824.33 while the previous day low was 1809.46. The daily 38.2% Fib levels comes at 1815.14, expected to provide support. Similarly, the daily 61.8% fib level is at 1818.65, expected to provide support.
Note the levels of interest below:
- Pivot support is noted at 1807.16, 1800.87, 1792.29
- Pivot resistance is noted at 1822.03, 1830.61, 1836.9
| Levels | Levels.1 |
|---|---|
| Previous Daily High | 1824.33 |
| Previous Daily Low | 1809.46 |
| Previous Weekly High | 1856.35 |
| Previous Weekly Low | 1804.76 |
| Previous Monthly High | 1959.80 |
| Previous Monthly Low | 1804.76 |
| Daily Fibonacci 38.2% | 1815.14 |
| Daily Fibonacci 61.8% | 1818.65 |
| Daily Pivot Point S1 | 1807.16 |
| Daily Pivot Point S2 | 1800.87 |
| Daily Pivot Point S3 | 1792.29 |
| Daily Pivot Point R1 | 1822.03 |
| Daily Pivot Point R2 | 1830.61 |
| Daily Pivot Point R3 | 1836.90 |
[/s2If]
Join Our Telegram Group


