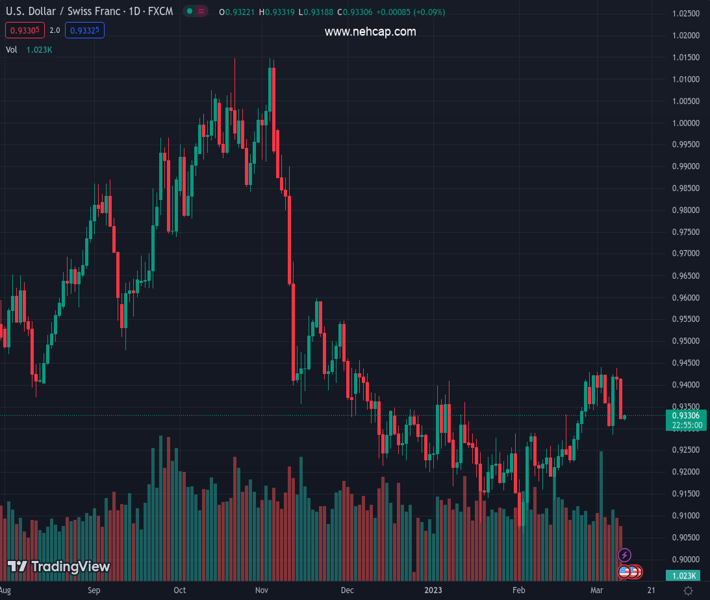
#USDCHF @ 0.93260 might continue its downside momentum to near 0.9300 amid signs of deceleration in the US labor market. (Pivot Orderbook analysis)
…
This is a premium post.
[s2If !current_user_can(access_s2member_level4)]Please register for PREMIUM VERSION HERE to read full post below containing analysis. In case of any error or you think you are not able to read the full post below, please email us at support#nehcap.com [lwa][/s2If] [s2If current_user_can(access_s2member_level4)]
- USD/CHF might continue its downside momentum to near 0.9300 amid signs of deceleration in the US labor market.
- Higher planned lay-off and an 11% jump in initial claims indicate that the US labor market is not tight enough.
- The theme of higher rates for a longer time might keep USD Index firmer in the coming months.
The pair currently trades last at 0.93260.
The previous day high was 0.9439 while the previous day low was 0.9389. The daily 38.2% Fib levels comes at 0.9408, expected to provide resistance. Similarly, the daily 61.8% fib level is at 0.942, expected to provide resistance.
The USD/CHF pair has displayed a sheer downside to near 0.9320 as investors have ignored risks associated with bigger rates announcements and higher terminal rates as endorsed by Federal Reserve (Fed) chair Jerome Powell in his testimony before Congress. The Swiss Franc asset is expected to continue its downside move to near the round-level support of 0.9300 amid an absence of loss in the downside momentum.
S&P500 futures faced immense selling pressure on Thursday as the characteristics of reducing a deficit of nearly $3 trillion by the next decade and a big stretch in taxes on corporations, billionaires, and rich investors discouraged investors. The US Dollar Index (DXY) also witnessed pressure and corrected gradually to 105.25 as an expression of fiscal deficit will also restrict inflation from flexing its muscles.
Apart from that, an 11% jump in the number of individuals filing for jobless claims for the very first time conveyed that the United States labor market is not as upbeat as it appears. Also, planned lay-off for February jumped four-fold on an annual basis, as reported by Reuters.
Signs of deceleration in the US labor market supported demand for US government bonds, which trimmed the 10-year US Treasury yields heavily to 3.90%.
Economists at Rabobank see the risks as being titled towards a firmer for longer USD in the coming months. “In the near term, the releases of US payrolls and Consumer Price Index (CPI) data are likely to be instrumental in guiding the direction of the USD Index. However, the risks that inflation could prove sticky suggest that the higher for longer interest rate theme could persist for months.”
On the Swiss Franc front, investors will focus on next week’s Producers and Import Prices data. A contraction of 0.1% is expected on a monthly basis. The annual data could improve to 3.4% from the former release of 3.3%. A monthly decline could delight the Swiss National Bank (SNB), which has already confronted that Swiss’ inflationary pressures are getting beyond its control.
Technical Levels: Supports and Resistances
USDCHF currently trading at 0.9332 at the time of writing. Pair opened at 0.9412 and is trading with a change of -0.85 % .
| Overview | Overview.1 | |
|---|---|---|
| 0 | Today last price | 0.9332 |
| 1 | Today Daily Change | -0.0080 |
| 2 | Today Daily Change % | -0.8500 |
| 3 | Today daily open | 0.9412 |
The pair is trading above its 20 Daily moving average @ 0.9314, above its 50 Daily moving average @ 0.9265 , below its 100 Daily moving average @ 0.9417 and below its 200 Daily moving average @ 0.9564
| Trends | Trends.1 | |
|---|---|---|
| 0 | Daily SMA20 | 0.9314 |
| 1 | Daily SMA50 | 0.9265 |
| 2 | Daily SMA100 | 0.9417 |
| 3 | Daily SMA200 | 0.9564 |
The previous day high was 0.9439 while the previous day low was 0.9389. The daily 38.2% Fib levels comes at 0.9408, expected to provide resistance. Similarly, the daily 61.8% fib level is at 0.942, expected to provide resistance.
Note the levels of interest below:
- Pivot support is noted at 0.9388, 0.9363, 0.9338
- Pivot resistance is noted at 0.9438, 0.9463, 0.9488
| Levels | Levels.1 |
|---|---|
| Previous Daily High | 0.9439 |
| Previous Daily Low | 0.9389 |
| Previous Weekly High | 0.9440 |
| Previous Weekly Low | 0.9342 |
| Previous Monthly High | 0.9429 |
| Previous Monthly Low | 0.9059 |
| Daily Fibonacci 38.2% | 0.9408 |
| Daily Fibonacci 61.8% | 0.9420 |
| Daily Pivot Point S1 | 0.9388 |
| Daily Pivot Point S2 | 0.9363 |
| Daily Pivot Point S3 | 0.9338 |
| Daily Pivot Point R1 | 0.9438 |
| Daily Pivot Point R2 | 0.9463 |
| Daily Pivot Point R3 | 0.9488 |
[/s2If]
Join Our Telegram Group


