#USDMXN @ 18.3470 Risk aversion bolstered the toward new weekly highs above $18.30. (Pivot Orderbook analysis)
…
This is a premium post.
[s2If !current_user_can(access_s2member_level4)]Please register for PREMIUM VERSION HERE to read full post below containing analysis. In case of any error or you think you are not able to read the full post below, please email us at support#nehcap.com [lwa][/s2If] [s2If current_user_can(access_s2member_level4)]
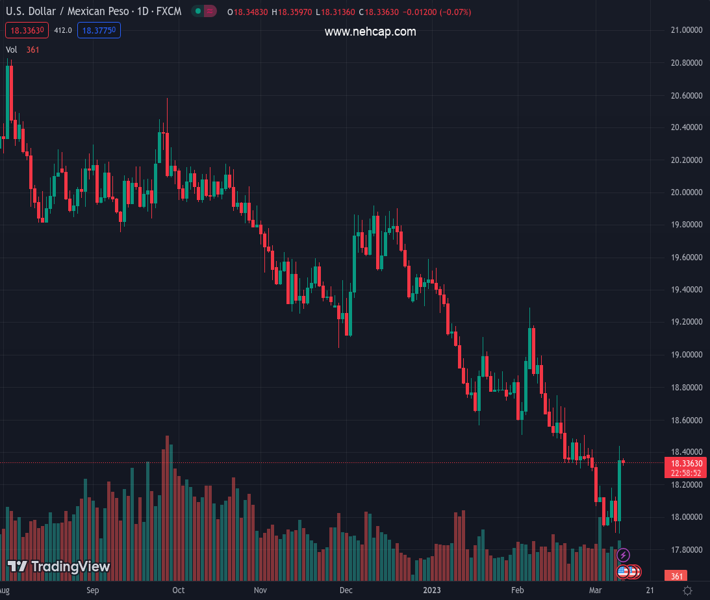
- Risk aversion bolstered the USD/MXN toward new weekly highs above $18.30.
- USD/MXN Price Analysis: The daily close above the 20-day EMA opened the door toward $18.60.
The pair currently trades last at 18.3470.
The previous day high was 18.1276 while the previous day low was 17.9022. The daily 38.2% Fib levels comes at 17.9884, expected to provide support. Similarly, the daily 61.8% fib level is at 18.0415, expected to provide support.
The Mexican Peso (MXN) is under pressure on Thursday; after reaching new 5-year lows at 17.8967, the USD/MXN has risen back towards the 18.0800 area. At around the Wall Street close, risk aversion pushed US equities lower, while the Mexican Peso depreciated the most since February 6, 2023. At the time of writing, the USD/MXN is gaining 2.07%, or 3700 pips, at 18.3323.
Also read: USD/MXN advances above the 18.00 figure as traders rush to safety
The USD/MXN stages a recovery after trading below the $18.00 barrier during the last few days. Earlier in the day, I wrote, “Nevertheless, USD/MXN bulls are far ahead of declaring victory. They must reclaim the weekly high at 18.1788, followed by the 20-day Exponential Moving Average (EMA) at 18.2898.” Later in the session, USD/MXN bulls reclaimed those levels as the exchange rate rests comfortably above the 20-day EMA. Additionally, Thursday’s close for the USD/MXN was 18.3483, which has opened the door for further upside.
That said, the USD/MXN first resistance would be the new weekly high of 18.4391. A breach of the latter will expose the $18.50 barrier, closely followed by the 50-day EMA at 18.6410 and the 100-day EMA at 19.0105.
On the flip side, the USD/MXN first support would e the 20-day EMA at 18.3169. Once cleared, and the USD/MXN pair will dive towards the March 7 high turned support at 18.1788, followed by the $18.00 psychological level.
Technical Levels: Supports and Resistances
USDMXN currently trading at 18.3334 at the time of writing. Pair opened at 17.9847 and is trading with a change of 1.94 % .
| Overview | Overview.1 | |
|---|---|---|
| 0 | Today last price | 18.3334 |
| 1 | Today Daily Change | 0.3487 |
| 2 | Today Daily Change % | 1.9400 |
| 3 | Today daily open | 17.9847 |
The pair remains strongly bearish on the daily time frame. It trades below the 20 SMA @ 18.3493, 50 SMA 18.7288, 100 SMA @ 19.1545 and 200 SMA @ 19.6575.
| Trends | Trends.1 | |
|---|---|---|
| 0 | Daily SMA20 | 18.3493 |
| 1 | Daily SMA50 | 18.7288 |
| 2 | Daily SMA100 | 19.1545 |
| 3 | Daily SMA200 | 19.6575 |
The previous day high was 18.1276 while the previous day low was 17.9022. The daily 38.2% Fib levels comes at 17.9884, expected to provide support. Similarly, the daily 61.8% fib level is at 18.0415, expected to provide support.
Note the levels of interest below:
- Pivot support is noted at 17.8821, 17.7795, 17.6567
- Pivot resistance is noted at 18.1075, 18.2303, 18.3329
| Levels | Levels.1 |
|---|---|
| Previous Daily High | 18.1276 |
| Previous Daily Low | 17.9022 |
| Previous Weekly High | 18.4235 |
| Previous Weekly Low | 17.9541 |
| Previous Monthly High | 19.2901 |
| Previous Monthly Low | 18.2954 |
| Daily Fibonacci 38.2% | 17.9884 |
| Daily Fibonacci 61.8% | 18.0415 |
| Daily Pivot Point S1 | 17.8821 |
| Daily Pivot Point S2 | 17.7795 |
| Daily Pivot Point S3 | 17.6567 |
| Daily Pivot Point R1 | 18.1075 |
| Daily Pivot Point R2 | 18.2303 |
| Daily Pivot Point R3 | 18.3329 |
[/s2If]
Join Our Telegram Group


