#NZDUSD @ 0.61218 seesaws around intraday high while keeping the bounce off 3.5-month low., @nehcap view: Limited recovery expected (Pivot Orderbook analysis)
…
This is a premium post.
[s2If !current_user_can(access_s2member_level4)]Please register for PREMIUM VERSION HERE to read full post below containing analysis. In case of any error or you think you are not able to read the full post below, please email us at support#nehcap.com [lwa][/s2If] [s2If current_user_can(access_s2member_level4)]
- NZD/USD seesaws around intraday high while keeping the bounce off 3.5-month low.
- 50-HMA, two-week-old horizontal resistance area restrict immediate run-up inside short-term bullish channel.
- Oscillators suggest slower grind towards the north but buyers need validation from 0.6200.
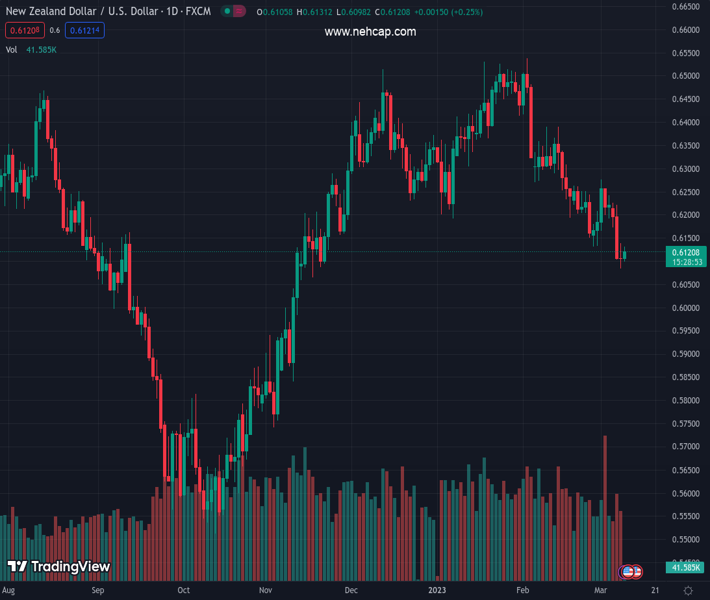
The pair currently trades last at 0.61218.
The previous day high was 0.6139 while the previous day low was 0.6084. The daily 38.2% Fib levels comes at 0.6105, expected to provide support. Similarly, the daily 61.8% fib level is at 0.6118, expected to provide support.
NZD/USD pares weekly losses around 0.6120 amid the early Thursday morning in Europe. In doing so, the Kiwi pair prints mild gains while snapping the previous three-day downtrend, as well as keeping the early-day rebound from the lowest levels since November 17, 2022.
While portraying the quote’s latest rebound, an ascending trend channel from Tuesday gains major attention.
That said, the NZD/USD price currently pokes a convergence of the fortnight-long horizontal resistance area, as well as the 50-Hour Moving Average (HMA), around 0.6130 by the press time.
It’s worth noting, however, that the bullish MACD signals and the recently firmer RSI (14) hints at the Kiwi pair’s further recovery, which in turn highlights the stated bullish channel’s top line near 0.6140.
In a case where the NZD/USD price remains firmer past 0.6140, a downward-sloping resistance line from March 01, close to 0.6195 by the press time, lure the buyers, a break of which could quickly propel the quote towards the monthly high of 0.6277.
On the flip side, a clear break of the stated bullish channel’s bottom line, around the 0.6100 round figure, could trigger a south-run targeting the 0.6000 psychological magnet. Though, the early September 2022 low near 0.5995 can act as an extra filter towards the south.
Overall, NZD/USD remains on the bear’s radar despite the latest corrective bounce.
Trend: Limited recovery expected
Technical Levels: Supports and Resistances
NZDUSD currently trading at 0.6125 at the time of writing. Pair opened at 0.6113 and is trading with a change of 0.20% % .
| Overview | Overview.1 | |
|---|---|---|
| 0 | Today last price | 0.6125 |
| 1 | Today Daily Change | 0.0012 |
| 2 | Today Daily Change % | 0.20% |
| 3 | Today daily open | 0.6113 |
The pair remains strongly bearish on the daily time frame. It trades below the 20 SMA @ 0.6233, 50 SMA 0.6328, 100 SMA @ 0.6232 and 200 SMA @ 0.6172.
| Trends | Trends.1 | |
|---|---|---|
| 0 | Daily SMA20 | 0.6233 |
| 1 | Daily SMA50 | 0.6328 |
| 2 | Daily SMA100 | 0.6232 |
| 3 | Daily SMA200 | 0.6172 |
The previous day high was 0.6139 while the previous day low was 0.6084. The daily 38.2% Fib levels comes at 0.6105, expected to provide support. Similarly, the daily 61.8% fib level is at 0.6118, expected to provide support.
Note the levels of interest below:
- Pivot support is noted at 0.6085, 0.6057, 0.603
- Pivot resistance is noted at 0.614, 0.6167, 0.6195
| Levels | Levels.1 |
|---|---|
| Previous Daily High | 0.6139 |
| Previous Daily Low | 0.6084 |
| Previous Weekly High | 0.6277 |
| Previous Weekly Low | 0.6131 |
| Previous Monthly High | 0.6538 |
| Previous Monthly Low | 0.6131 |
| Daily Fibonacci 38.2% | 0.6105 |
| Daily Fibonacci 61.8% | 0.6118 |
| Daily Pivot Point S1 | 0.6085 |
| Daily Pivot Point S2 | 0.6057 |
| Daily Pivot Point S3 | 0.6030 |
| Daily Pivot Point R1 | 0.6140 |
| Daily Pivot Point R2 | 0.6167 |
| Daily Pivot Point R3 | 0.6195 |
[/s2If]
Join Our Telegram Group


