Asian stocks are demonstrating caution amid fears of bigger Fed rates and China’s weak economic recovery. (Pivot Orderbook analysis)
…
This is a premium post.
[s2If !current_user_can(access_s2member_level4)]Please register for PREMIUM VERSION HERE to read full post below containing analysis. In case of any error or you think you are not able to read the full post below, please email us at support#nehcap.com [lwa][/s2If] [s2If current_user_can(access_s2member_level4)]
- Asian stocks are demonstrating caution amid fears of bigger Fed rates and China’s weak economic recovery.
- Nikkei225 has gained strength as the street is anticipating an ultra-dovish stance by BoJ Kuroda.
- The US EIA reported a decline in the oil inventories by 1.694 million barrels for the week ending March 03.
The pair currently trades last at 28604.48.
The previous day high was 28630.69 while the previous day low was 28278.61. The daily 38.2% Fib levels comes at 28496.2, expected to provide support. Similarly, the daily 61.8% fib level is at 28413.1, expected to provide support.
Markets in the Asian domain are mostly cautious as a bigger interest rate hike by the Federal Reserve (Fed) in its March monetary policy meeting looks almost confirmed. This has fueled fears of a recession in the United States. S&P500 futures are facing pressures after the release of headlines claiming that US President Joe Biden has proposed higher taxes for United States billionaires and rich investors. Corporation tax is expected to scale to 28% from 21% in the upcoming budget.
At the press time, Japan’s Nikkei225 jumped 0.47%, ChinaA50 surrendered 0.60%, Hang Seng eases 0.08%, and Nifty50 dropped 0.62%.
Chinese stocks have turned vulnerable to a dismal economic outlook. A contraction in the monthly Consumer Price Index (CPI) by 0.5% has conveyed that the economic recovery is extremely sluggish and investors have to maintain patience for a long period to discover China’s reopening-led recovery. The street was expecting that after the rollback of lockdown curbs, Chinese recovery will be quick. However, the economic data is not portraying the same. Producer Price index (PPI) figures have shown deflation on an annual basis, indicating poor demand from households.
Meanwhile, Nikkei225 has gained strength as the street is anticipating the maintenance of an ultra-dovish stance by Bank of Japan (BoJ) Governor Haruhiko Kuroda in his last monetary policy meeting. A Reuters poll on an end to the expansion policy cycle dictates that BoJ will start unwinding its ultra-easy policy in April. Also, the market participants are expecting further tweaks in the Yield Curve Control (YCC) in April-June.
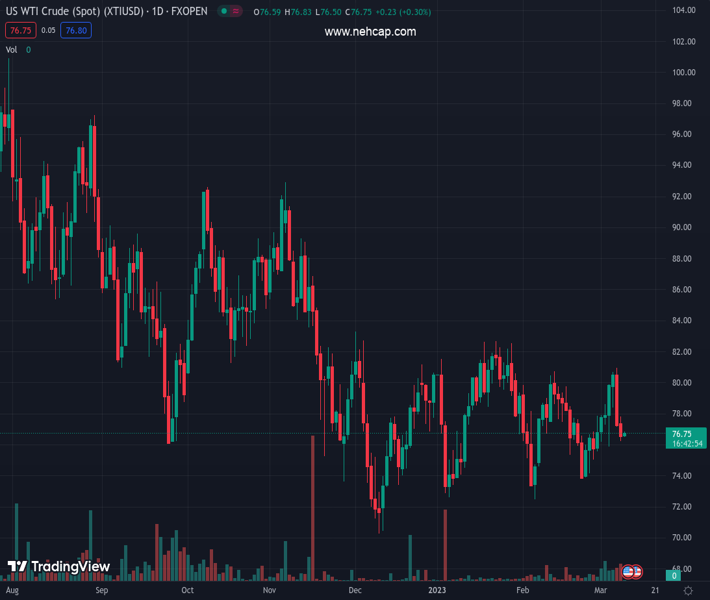
On the oil front, the oil price is expected to resume its downside journey as weak recovery in the Chinese economy and expectations of more rates from the Fed are indicating a sheer fall in the global demand for oil. Investors have also ignored the slippage in the oil stockpiles managed by the US Energy Information Administration (EIA). The US EIA reported a decline in the oil inventories by 1.694 million barrels for the week ending March 03.
Technical Levels: Supports and Resistances
XTIUSD currently trading at 28604.48 at the time of writing. Pair opened at 28604.48 and is trading with a change of 0.0 % .
| Overview | Overview.1 | |
|---|---|---|
| 0 | Today last price | 28604.48 |
| 1 | Today Daily Change | 0.00 |
| 2 | Today Daily Change % | 0.00 |
| 3 | Today daily open | 28604.48 |
The pair remains strongly bullish on the daily timeframe. It trades above its 20 SMA @ 27675.69, 50 SMA 27117.23, 100 SMA @ 27337.86 and 200 SMA @ 27348.55.
| Trends | Trends.1 | |
|---|---|---|
| 0 | Daily SMA20 | 27675.69 |
| 1 | Daily SMA50 | 27117.23 |
| 2 | Daily SMA100 | 27337.86 |
| 3 | Daily SMA200 | 27348.55 |
The previous day high was 28630.69 while the previous day low was 28278.61. The daily 38.2% Fib levels comes at 28496.2, expected to provide support. Similarly, the daily 61.8% fib level is at 28413.1, expected to provide support.
Note the levels of interest below:
- Pivot support is noted at 28378.5, 28152.51, 28026.42
- Pivot resistance is noted at 28730.58, 28856.67, 29082.66
| Levels | Levels.1 |
|---|---|
| Previous Daily High | 28630.69 |
| Previous Daily Low | 28278.61 |
| Previous Weekly High | 28242.05 |
| Previous Weekly Low | 27341.70 |
| Previous Monthly High | 27812.68 |
| Previous Monthly Low | 26985.47 |
| Daily Fibonacci 38.2% | 28496.20 |
| Daily Fibonacci 61.8% | 28413.10 |
| Daily Pivot Point S1 | 28378.50 |
| Daily Pivot Point S2 | 28152.51 |
| Daily Pivot Point S3 | 28026.42 |
| Daily Pivot Point R1 | 28730.58 |
| Daily Pivot Point R2 | 28856.67 |
| Daily Pivot Point R3 | 29082.66 |
[/s2If]
Join Our Telegram Group


