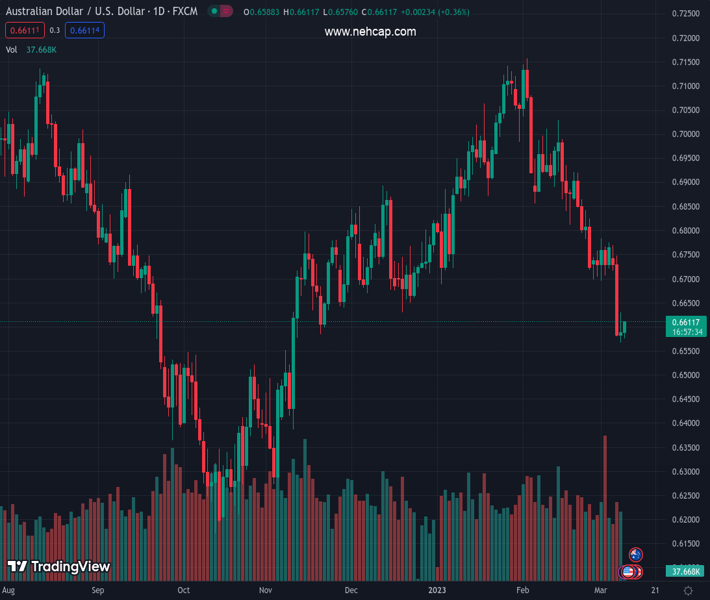
#AUDUSD @ 0.66088 is attempting to scale above 0.6600, however, the risk-off mood is still intact. (Pivot Orderbook analysis)
…
This is a premium post.
[s2If !current_user_can(access_s2member_level4)]Please register for PREMIUM VERSION HERE to read full post below containing analysis. In case of any error or you think you are not able to read the full post below, please email us at support#nehcap.com [lwa][/s2If] [s2If current_user_can(access_s2member_level4)]
- AUD/USD is attempting to scale above 0.6600, however, the risk-off mood is still intact.
- A Doji candlestick formation indicates indecisiveness among market participants.
- An oscillation in the 20.00-40.00 range by the RSI (14) indicates that the bearish momentum is currently active.
The pair currently trades last at 0.66088.
The previous day high was 0.6629 while the previous day low was 0.6568. The daily 38.2% Fib levels comes at 0.6606, expected to provide support. Similarly, the daily 61.8% fib level is at 0.6591, expected to provide support.
The AUD/USD pair is displaying a subdued performance below 0.6600 in the Asian session. The upside in the Aussie asset seems restricted as Reserve Bank of Australia (RBA) Governor Philip Lowe has considered a pause in the rate-hiking spree and the Chinese economy is struggling to accelerate domestic demand despite significant reopening measures.
S&P500 futures have witnessed immense pressure as a sense of deflation conveyed by Chinese Consumer Price Index (CPI) and Producer Price Index (PPI) data indicates that the economy will take plenty of time to strengthen its economic outlook.
The US Dollar Index (DXY) is auctioning in a limited range above 105.20 as investors are awaiting the release of the United States Nonfarm Payrolls (NFP) data for fresh impetus.
AUD/USD has formed a Doji candlestick pattern, which indicates indecisiveness among the sentiment of market participants for further direction. Usually, a Doji formation indicates a reversal after an established trend. However, it requires more filters to confirm a reversal. Also, the negligence of Doji is considered as the continuation of the ongoing trend.
The Australian Dollar might continue to face selling pressure from the 10-period Exponential Moving Average (EMA) at around 0.6700.
An oscillation in the 20.00-40.00 range by the Relative Strength Index (RSI) (14) indicates that the bearish momentum is currently active. The momentum indicator is not shown any sign of divergence and a situation of oversold.
Going forward, a breakdown of Wednesday’s low at 0.6568 will drag the asst toward the horizontal support plotted from October 4 high at 0.6547 followed by the round-level support at 0.6500.
In an alternate scenario, a break above Doji’s high at 0.6629 will push the Aussie asset toward December 22 low at 0.6650. A break above the same might expose the major to February 27 low near 0.6700.
Technical Levels: Supports and Resistances
AUDUSD currently trading at 0.6596 at the time of writing. Pair opened at 0.6594 and is trading with a change of 0.03 % .
| Overview | Overview.1 | |
|---|---|---|
| 0 | Today last price | 0.6596 |
| 1 | Today Daily Change | 0.0002 |
| 2 | Today Daily Change % | 0.0300 |
| 3 | Today daily open | 0.6594 |
The pair remains strongly bearish on the daily time frame. It trades below the 20 SMA @ 0.6811, 50 SMA 0.6893, 100 SMA @ 0.676 and 200 SMA @ 0.6784.
| Trends | Trends.1 | |
|---|---|---|
| 0 | Daily SMA20 | 0.6811 |
| 1 | Daily SMA50 | 0.6893 |
| 2 | Daily SMA100 | 0.6760 |
| 3 | Daily SMA200 | 0.6784 |
The previous day high was 0.6629 while the previous day low was 0.6568. The daily 38.2% Fib levels comes at 0.6606, expected to provide support. Similarly, the daily 61.8% fib level is at 0.6591, expected to provide support.
Note the levels of interest below:
- Pivot support is noted at 0.6565, 0.6536, 0.6504
- Pivot resistance is noted at 0.6626, 0.6658, 0.6687
| Levels | Levels.1 |
|---|---|
| Previous Daily High | 0.6629 |
| Previous Daily Low | 0.6568 |
| Previous Weekly High | 0.6784 |
| Previous Weekly Low | 0.6695 |
| Previous Monthly High | 0.7158 |
| Previous Monthly Low | 0.6698 |
| Daily Fibonacci 38.2% | 0.6606 |
| Daily Fibonacci 61.8% | 0.6591 |
| Daily Pivot Point S1 | 0.6565 |
| Daily Pivot Point S2 | 0.6536 |
| Daily Pivot Point S3 | 0.6504 |
| Daily Pivot Point R1 | 0.6626 |
| Daily Pivot Point R2 | 0.6658 |
| Daily Pivot Point R3 | 0.6687 |
[/s2If]
Join Our Telegram Group


