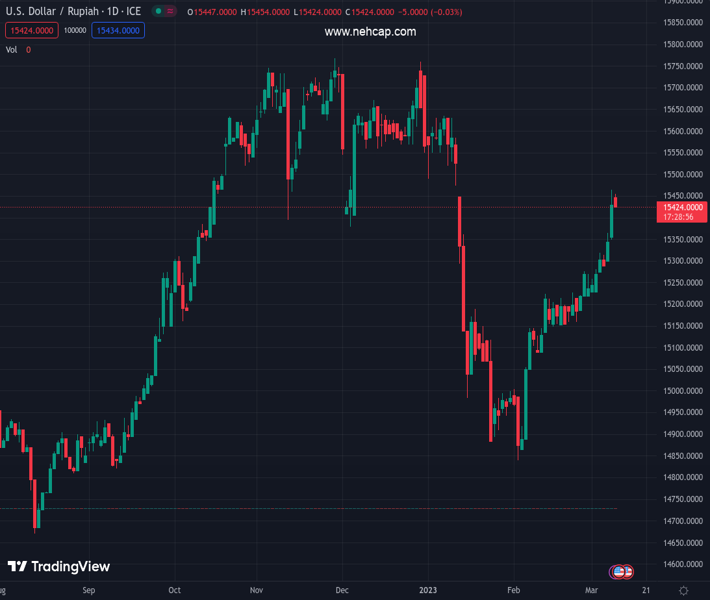
#USDIDR @ 15,425.0 holds lower ground near intraday bottom after reversing from multi-day top. (Pivot Orderbook analysis)
…
This is a premium post.
[s2If !current_user_can(access_s2member_level4)]Please register for PREMIUM VERSION HERE to read full post below containing analysis. In case of any error or you think you are not able to read the full post below, please email us at support#nehcap.com [lwa][/s2If] [s2If current_user_can(access_s2member_level4)]
- USD/IDR holds lower ground near intraday bottom after reversing from multi-day top.
- Indonesia Retail Sales growth plummets to multi-month low in January.
- US Dollar’s pullback amid sluggish markets, positioning for Friday’s NFP seem to probe pair buyers.
The pair currently trades last at 15425.0.
The previous day high was 15471.25 while the previous day low was 15359.0. The daily 38.2% Fib levels comes at 15428.3705, expected to provide resistance. Similarly, the daily 61.8% fib level is at 15401.8795, expected to provide support.
USD/IDR remains sidelined near 15,440, recently making rounds to the intraday low, even as Indonesia Retail Sales flashed disappointing data early Thursday. In doing so, the Indonesia Rupiah (IDR) pair retreats from a two-month high while snapping a three-day uptrend amid a broad US Dollar retreat.
That said, Indonesia’s Retail Sales marked a 0.6% YoY contraction in January versus 0.7% previous rise. With this, the key statistics dropped to the lowest levels since September 2021 while snapping the 15-month winning streak.
US Dollar Index (DXY) prints the first daily gains in three while keeping the early Asian session pullback from the highest levels since December 01, 2022. That said, the DXY’s latest moves seem to pay a little attention to the sour sentiment as the greenback buyers brace for Friday’s all-important US jobs report for February amid upbeat early signals.
Talking about the sentiment, the S&P 500 Futures struggles for clear directions after bouncing off a one-week low the previous day. On the same line, the US 10-year Treasury bond yields rise to 3.99%, up one basis point (bp), whereas the two-year counterpart pares intraday losses near 5.05% at the latest. It’s worth noting that US yield curve inversion widened to the highest levels since 1981 and propelled the recession fears on Wednesday. However, an absence surprise in Fed Chair Powell’s Testimony 2.0 and mixed US data seemed to have triggered the US Dollar’s latest pullback.
On Wednesday, the US ADP Employment Change rose to 242K in February versus 200K market forecasts and 119K prior (revised). Further, the US Goods and Services Trade Balance dropped to $-68.3B from the $-67.2B previous reading (revised) and $-68.9B analysts’ estimations. It should be noted that the US JOLTS Job Openings for January improved to 10.824M versus 10.6M expected but eased from 11.234M revised prior.
It should be noted that the risk profile weakened early Thursday amid headlines suggesting US President Joe Biden’s proposal for higher taxes, which in turn appears an extra economic burden amid the looming recession woes.
Looking forward, US Initial Jobless Claims for the week ended on March 03 will join the Challenger Job Cuts for February to entertain intraday traders of the USD/IDR.
Despite the latest retreat, a daily closing below the 100-DMA level surrounding 15,420 becomes necessary for the USD/IDR bears to retake control.
Technical Levels: Supports and Resistances
USDIDR currently trading at 15439 at the time of writing. Pair opened at 15441.65 and is trading with a change of -0.02% % .
| Overview | Overview.1 | |
|---|---|---|
| 0 | Today last price | 15439 |
| 1 | Today Daily Change | -2.6500 |
| 2 | Today Daily Change % | -0.02% |
| 3 | Today daily open | 15441.65 |
The pair remains strongly bullish on the daily timeframe. It trades above its 20 SMA @ 15245.075, 50 SMA 15237.636, 100 SMA @ 15424.263 and 200 SMA @ 15183.6495.
| Trends | Trends.1 | |
|---|---|---|
| 0 | Daily SMA20 | 15245.0750 |
| 1 | Daily SMA50 | 15237.6360 |
| 2 | Daily SMA100 | 15424.2630 |
| 3 | Daily SMA200 | 15183.6495 |
The previous day high was 15471.25 while the previous day low was 15359.0. The daily 38.2% Fib levels comes at 15428.3705, expected to provide resistance. Similarly, the daily 61.8% fib level is at 15401.8795, expected to provide support.
Note the levels of interest below:
- Pivot support is noted at 15376.6833, 15311.7167, 15264.4333
- Pivot resistance is noted at 15488.9333, 15536.2167, 15601.1833
| Levels | Levels.1 |
|---|---|
| Previous Daily High | 15471.2500 |
| Previous Daily Low | 15359.0000 |
| Previous Weekly High | 15380.0500 |
| Previous Weekly Low | 15206.9500 |
| Previous Monthly High | 15380.0500 |
| Previous Monthly Low | 14835.0000 |
| Daily Fibonacci 38.2% | 15428.3705 |
| Daily Fibonacci 61.8% | 15401.8795 |
| Daily Pivot Point S1 | 15376.6833 |
| Daily Pivot Point S2 | 15311.7167 |
| Daily Pivot Point S3 | 15264.4333 |
| Daily Pivot Point R1 | 15488.9333 |
| Daily Pivot Point R2 | 15536.2167 |
| Daily Pivot Point R3 | 15601.1833 |
[/s2If]
Join Our Telegram Group


