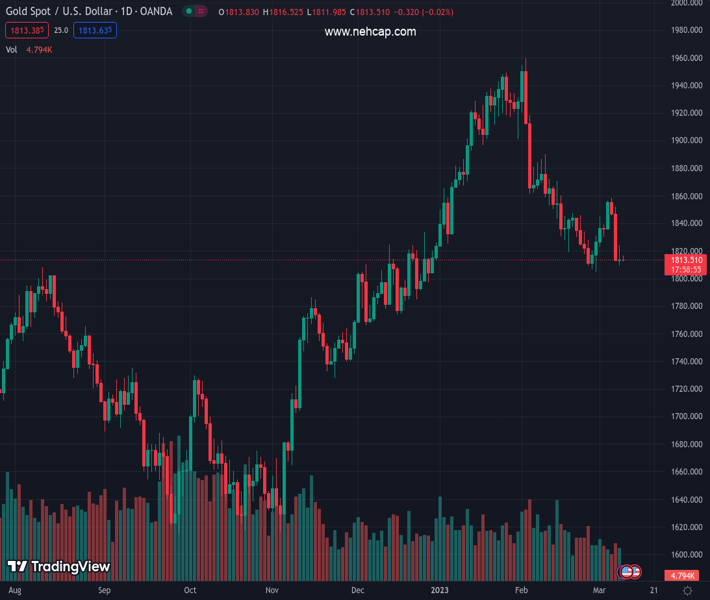
#XAUUSD @ 1,813.70 Gold price is struggling to sustain above $1,800.00 amid rising bets for hawkish Fed policy. (Pivot Orderbook analysis)
…
This is a premium post.
[s2If !current_user_can(access_s2member_level4)]Please register for PREMIUM VERSION HERE to read full post below containing analysis. In case of any error or you think you are not able to read the full post below, please email us at support#nehcap.com [lwa][/s2If] [s2If current_user_can(access_s2member_level4)]
- Gold price is struggling to sustain above $1,800.00 amid rising bets for hawkish Fed policy.
- The risk-aversion theme has heated further as China has shown deflation in the CPI and PPI figures.
- Higher funds in the pocket of US households due to rising labor cost index might propel consumer spending.
The pair currently trades last at 1813.70.
The previous day high was 1824.33 while the previous day low was 1809.46. The daily 38.2% Fib levels comes at 1815.14, expected to provide resistance. Similarly, the daily 61.8% fib level is at 1818.65, expected to provide resistance.
Gold price (XAU/USD) looks vulnerable above $1,810.00 as the upside looks capped amid rising bets for bigger rates by the Federal Reserve (Fed). The precious metal is expected to resume its downside journey as strong United States Employment data reported by Automatic Data Processing (ADP) has confirmed that January’s strong consumer spending and higher payrolls were not a one-time shock to the declining Consumer Price Index (CPI).
S&P500 futures have surrendered their marginal gains added on Wednesday in the Asian session. The risk-aversion theme has heated further as China has shown deflation in the CPI and Producer Price Index (PPI) figures. The US Dollar Index (DXY) has continued its sideways performance above 105.20 as investors are awaiting the release of the US Nonfarm Payrolls (NFP) data for fresh cues. Meanwhile, the alpha provided on 10-year US Treasury bonds has rebounded above 3.98%.
The official US Employment data is expected to show a decline in the payrolls to 203K from the former release of 514k. A figure of 203K is not as bad but looks worthless in front of January’s 514K figure. Investors should be aware that a figure of 514K was an exceptional one in the past seven months.
Apart from that, the Unemployment Rate is expected to maintain the lowest multi-decade figure of 3.4%. The Average Hourly Earnings are expected to climb to 4.8% on an annual basis. Higher funds in the pocket of households might propel consumer spending. Fed chair Jerome Powell has already confirmed bigger rates to scale down sticky inflation.
Gold price is auctioning in an Inverted Flag chart pattern on an hourly scale, which is a trend-following pattern and is bolstering the case of further downside ahead. The chart pattern displays a long consolidation that is followed by a breakdown. Usually, the consolidation phase of the chart pattern serves as an inventory adjustment in which those participants initiate shorts, which prefer to enter an auction after the establishment of a bearish bias.
The 30-period Exponential Moving Average (EMA) at $1,817.24 is acting as a major barricade for the Gold bulls.
Meanwhile, the Relative Strength Index (RSI) (14) is struggling to sustain in the 40.00-60.00 range. A breakdown into the bearish range of 20.00-40.00 will trigger the downside momentum.
Technical Levels: Supports and Resistances
XAUUSD currently trading at 1812.78 at the time of writing. Pair opened at 1813.44 and is trading with a change of -0.04 % .
| Overview | Overview.1 | |
|---|---|---|
| 0 | Today last price | 1812.78 |
| 1 | Today Daily Change | -0.66 |
| 2 | Today Daily Change % | -0.04 |
| 3 | Today daily open | 1813.44 |
The pair is trading below its 20 Daily moving average @ 1836.7, below its 50 Daily moving average @ 1869.82 , above its 100 Daily moving average @ 1806.3 and above its 200 Daily moving average @ 1775.16
| Trends | Trends.1 | |
|---|---|---|
| 0 | Daily SMA20 | 1836.70 |
| 1 | Daily SMA50 | 1869.82 |
| 2 | Daily SMA100 | 1806.30 |
| 3 | Daily SMA200 | 1775.16 |
The previous day high was 1824.33 while the previous day low was 1809.46. The daily 38.2% Fib levels comes at 1815.14, expected to provide resistance. Similarly, the daily 61.8% fib level is at 1818.65, expected to provide resistance.
Note the levels of interest below:
- Pivot support is noted at 1807.16, 1800.87, 1792.29
- Pivot resistance is noted at 1822.03, 1830.61, 1836.9
| Levels | Levels.1 |
|---|---|
| Previous Daily High | 1824.33 |
| Previous Daily Low | 1809.46 |
| Previous Weekly High | 1856.35 |
| Previous Weekly Low | 1804.76 |
| Previous Monthly High | 1959.80 |
| Previous Monthly Low | 1804.76 |
| Daily Fibonacci 38.2% | 1815.14 |
| Daily Fibonacci 61.8% | 1818.65 |
| Daily Pivot Point S1 | 1807.16 |
| Daily Pivot Point S2 | 1800.87 |
| Daily Pivot Point S3 | 1792.29 |
| Daily Pivot Point R1 | 1822.03 |
| Daily Pivot Point R2 | 1830.61 |
| Daily Pivot Point R3 | 1836.90 |
[/s2If]
Join Our Telegram Group


