#EURUSD @ 1.05442 struggles for clear directions after challenging the bears at two-month low., @nehcap view: Limited recovery expected (Pivot Orderbook analysis)
…
This is a premium post.
[s2If !current_user_can(access_s2member_level4)]Please register for PREMIUM VERSION HERE to read full post below containing analysis. In case of any error or you think you are not able to read the full post below, please email us at support#nehcap.com [lwa][/s2If] [s2If current_user_can(access_s2member_level4)]
- EUR/USD struggles for clear directions after challenging the bears at two-month low.
- Trend reversal suggesting candlestick, rebound from 100-DMA join sluggish oscillators to lure buyers.
- Previous support line from the last December challenges Euro buyers.
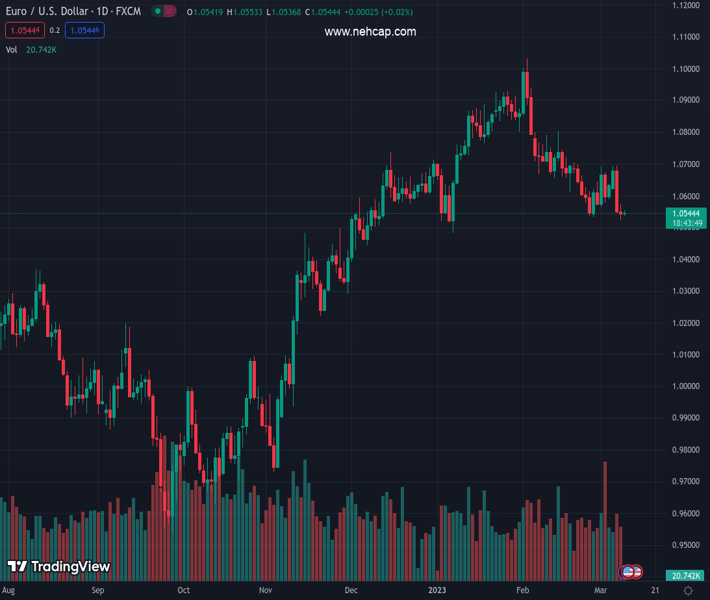
The pair currently trades last at 1.05442.
The previous day high was 1.0574 while the previous day low was 1.0524. The daily 38.2% Fib levels comes at 1.0543, expected to provide support. Similarly, the daily 61.8% fib level is at 1.0555, expected to provide resistance.
EUR/USD treads water around 1.0550, despite fading the previous day’s bounce off the lowest level since January 2023, as mixed technical details challenge traders during early Thursday’s sluggish trading session.
The Euro pair dropped to a fresh two-month low on Wednesday before bouncing off 1.0524. However, the quote ended the day’s trading with minor changes from the opening levels and hence portrayed a Doji candlestick that suggests a corrective bounce in the EUR/USD price.
It should be noted that the Doji’s existence at a whisker beyond 100-DMA also keeps the EUR/USD buyers hopeful, especially amid the sluggish MACD and RSI signals.
In a case where the Euro pair breaks the immediate 100-DMA support of around 1.0525, bears may have a bumpy road ahead due to the lows marked in January and early December 2022, respectively near 1.0480 and 1.0440. Also acting as a downside filter is the 200-DMA support of 1.0325.
On the flip side, a daily closing beyond the previous support line from December 07, 2022, near 1.0570 by the press time, becomes necessary for the EUR/USD buyer’s conviction.
Even so, the weekly high of around 1.0700 and the mid-February peak surrounding 1.0800 can act as extra filters towards the north.
Overall, EUR/USD is likely to remain bearish even if a corrective bounce is expected for the short term.
Trend: Limited recovery expected
Technical Levels: Supports and Resistances
EURUSD currently trading at 1.0545 at the time of writing. Pair opened at 1.0548 and is trading with a change of -0.03% % .
| Overview | Overview.1 | |
|---|---|---|
| 0 | Today last price | 1.0545 |
| 1 | Today Daily Change | -0.0003 |
| 2 | Today Daily Change % | -0.03% |
| 3 | Today daily open | 1.0548 |
The pair is trading below its 20 Daily moving average @ 1.0644, below its 50 Daily moving average @ 1.0725 , above its 100 Daily moving average @ 1.0519 and above its 200 Daily moving average @ 1.0327
| Trends | Trends.1 | |
|---|---|---|
| 0 | Daily SMA20 | 1.0644 |
| 1 | Daily SMA50 | 1.0725 |
| 2 | Daily SMA100 | 1.0519 |
| 3 | Daily SMA200 | 1.0327 |
The previous day high was 1.0574 while the previous day low was 1.0524. The daily 38.2% Fib levels comes at 1.0543, expected to provide support. Similarly, the daily 61.8% fib level is at 1.0555, expected to provide resistance.
Note the levels of interest below:
- Pivot support is noted at 1.0523, 1.0499, 1.0474
- Pivot resistance is noted at 1.0573, 1.0598, 1.0622
| Levels | Levels.1 |
|---|---|
| Previous Daily High | 1.0574 |
| Previous Daily Low | 1.0524 |
| Previous Weekly High | 1.0692 |
| Previous Weekly Low | 1.0533 |
| Previous Monthly High | 1.1033 |
| Previous Monthly Low | 1.0533 |
| Daily Fibonacci 38.2% | 1.0543 |
| Daily Fibonacci 61.8% | 1.0555 |
| Daily Pivot Point S1 | 1.0523 |
| Daily Pivot Point S2 | 1.0499 |
| Daily Pivot Point S3 | 1.0474 |
| Daily Pivot Point R1 | 1.0573 |
| Daily Pivot Point R2 | 1.0598 |
| Daily Pivot Point R3 | 1.0622 |
[/s2If]
Join Our Telegram Group


