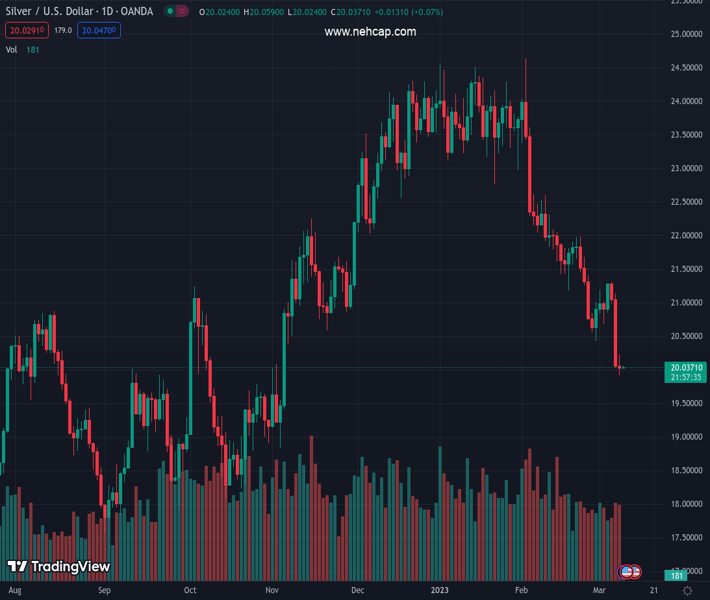
#XAGUSD @ 20.035 Silver price stabilizes after sliding close to 5% on Tuesday. (Pivot Orderbook analysis)
…
This is a premium post.
[s2If !current_user_can(access_s2member_level4)]Please register for PREMIUM VERSION HERE to read full post below containing analysis. In case of any error or you think you are not able to read the full post below, please email us at support#nehcap.com [lwa][/s2If] [s2If current_user_can(access_s2member_level4)]
- Silver price stabilizes after sliding close to 5% on Tuesday.
- XAG/USD Price Analysis: To resume its downward bias after dropping below $21.00.
The pair currently trades last at 20.035.
The previous day high was 21.14 while the previous day low was 20.03. The daily 38.2% Fib levels comes at 20.46, expected to provide resistance. Similarly, the daily 61.8% fib level is at 20.72, expected to provide resistance.
Silver price reached a multi-month low of around $19.92, but buyers stepped in, dragging the XAG/USD price above the $20.00 figure.
Wall Street finished the session mixed. The US Federal Reserve Chair Jerome Powell rattled the US equities market after commenting that to testify against the US Congress with a consistent hawkish tone. Therefore, the US Dollar (USD) consolidates yesterday’s gains, as shown by the US Dollar Index up 0.09%, at 105.710.
After dropping almost 5% on Tuesday, the XAG/USD collapse appears to have found a temporal bottom. The XAG/USD printed a new YTD low at $19.92. Wednesday’s price action formed a doji, indicating that buyers and sellers are at equilibrium. The Relative Strength Index (RSI) is at oversold conditions as sellers take a breather, while the Rate of Change (RoC) suggests that sellers are gathering momentum.
If the XAG/USD tumbles below the YTD low at $19.92, the next line of defense for XAG bulls would be $19.00, ahead of sliding toward November’s 3 low at $18.84.
In an alternate scenario, the XAG/USD first resistance would be February’s 28 daily low turned resistance at $20.43. A breach of the latter will clear the pave toward March’s 2 low at $20.68, before testing the $21.00 psychological level.
Technical Levels: Supports and Resistances
XAGUSD currently trading at 20.05 at the time of writing. Pair opened at 20.08 and is trading with a change of -0.15 % .
| Overview | Overview.1 | |
|---|---|---|
| 0 | Today last price | 20.05 |
| 1 | Today Daily Change | -0.03 |
| 2 | Today Daily Change % | -0.15 |
| 3 | Today daily open | 20.08 |
The pair remains strongly bearish on the daily time frame. It trades below the 20 SMA @ 21.41, 50 SMA 22.73, 100 SMA @ 22.16 and 200 SMA @ 20.97.
| Trends | Trends.1 | |
|---|---|---|
| 0 | Daily SMA20 | 21.41 |
| 1 | Daily SMA50 | 22.73 |
| 2 | Daily SMA100 | 22.16 |
| 3 | Daily SMA200 | 20.97 |
The previous day high was 21.14 while the previous day low was 20.03. The daily 38.2% Fib levels comes at 20.46, expected to provide resistance. Similarly, the daily 61.8% fib level is at 20.72, expected to provide resistance.
Note the levels of interest below:
- Pivot support is noted at 19.7, 19.31, 18.59
- Pivot resistance is noted at 20.81, 21.53, 21.91
| Levels | Levels.1 |
|---|---|
| Previous Daily High | 21.14 |
| Previous Daily Low | 20.03 |
| Previous Weekly High | 21.27 |
| Previous Weekly Low | 20.42 |
| Previous Monthly High | 24.64 |
| Previous Monthly Low | 20.42 |
| Daily Fibonacci 38.2% | 20.46 |
| Daily Fibonacci 61.8% | 20.72 |
| Daily Pivot Point S1 | 19.70 |
| Daily Pivot Point S2 | 19.31 |
| Daily Pivot Point S3 | 18.59 |
| Daily Pivot Point R1 | 20.81 |
| Daily Pivot Point R2 | 21.53 |
| Daily Pivot Point R3 | 21.91 |
[/s2If]
Join Our Telegram Group


