#NZDUSD @ 0.61073 fades bounce off the lowest levels since late November 2022 inside one-month-old descending trend channel., @nehcap view: Further downside expected (Pivot Orderbook analysis)
…
This is a premium post.
[s2If !current_user_can(access_s2member_level4)]Please register for PREMIUM VERSION HERE to read full post below containing analysis. In case of any error or you think you are not able to read the full post below, please email us at support#nehcap.com [lwa][/s2If] [s2If current_user_can(access_s2member_level4)]
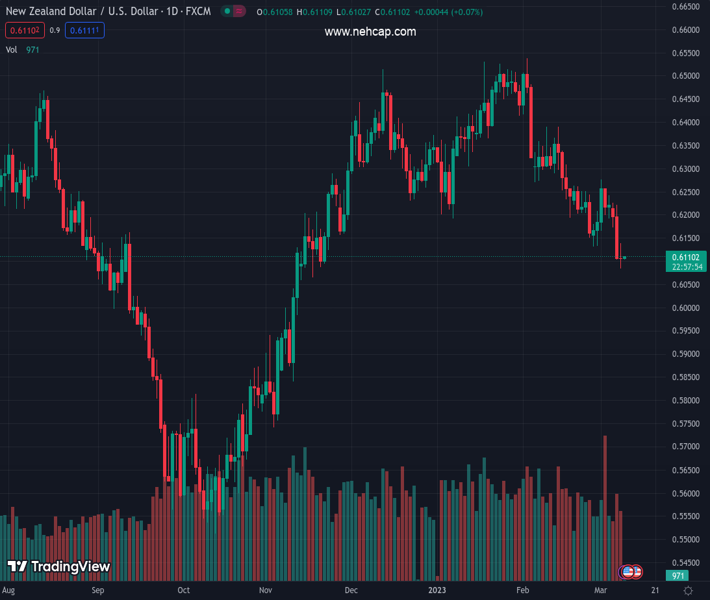
- NZD/USD fades bounce off the lowest levels since late November 2022 inside one-month-old descending trend channel.
- Failure to cross previous support line from early January, bearish MACD signals keep sellers hopeful.
- Recovery remains elusive below 200-SMA, 0.6215-20 acts as an additional upside filter.
The pair currently trades last at 0.61073.
The previous day high was 0.6223 while the previous day low was 0.6103. The daily 38.2% Fib levels comes at 0.6149, expected to provide resistance. Similarly, the daily 61.8% fib level is at 0.6177, expected to provide resistance.
NZD/USD retreat towards the multi-day low marked the previous day while staying with a one-month-old descending trend channel, pressured around 0.6105 during the early Thursday morning in the Asia-Pacific zone.
In doing so, the Kiwi pair portrays the inability to cross the two-month-long previous support line, now immediate resistance near 0.6130. Adding strength to the downside bias are the bearish MACD signals.
It’s worth noting, however, that the lower line of the aforementioned bearish channel, around 0.6070 by the press time, as well as the lows marked during mid-November 2022 near 0.6060, can act as crucial supports to watch during the NZD/USD pair’s further downside.
Should the Kiwi pair remains bearish past 0.6060, the odds of witnessing a slump toward the 0.6000 psychological magnet can’t be ruled out.
Alternatively, recovery moves remain elusive unless the quote stays below the support-turned-resistance line near 0.6130.
Even so, a convergence of the 100-SMA and the stated channel’s top line, close to 0.6215-20 at the latest, will be important for the NZD/USD buyers to break before retaking control.
Above all, the Kiwi pair remains on the bear’s radar unless it successfully trades above the 200-SMA hurdle surrounding 0.6315.
Trend: Further downside expected
Technical Levels: Supports and Resistances
NZDUSD currently trading at 0.6107 at the time of writing. Pair opened at 0.6114 and is trading with a change of -0.11% % .
| Overview | Overview.1 | |
|---|---|---|
| 0 | Today last price | 0.6107 |
| 1 | Today Daily Change | -0.0007 |
| 2 | Today Daily Change % | -0.11% |
| 3 | Today daily open | 0.6114 |
The pair remains strongly bearish on the daily time frame. It trades below the 20 SMA @ 0.6243, 50 SMA 0.6332, 100 SMA @ 0.6227 and 200 SMA @ 0.6174.
| Trends | Trends.1 | |
|---|---|---|
| 0 | Daily SMA20 | 0.6243 |
| 1 | Daily SMA50 | 0.6332 |
| 2 | Daily SMA100 | 0.6227 |
| 3 | Daily SMA200 | 0.6174 |
The previous day high was 0.6223 while the previous day low was 0.6103. The daily 38.2% Fib levels comes at 0.6149, expected to provide resistance. Similarly, the daily 61.8% fib level is at 0.6177, expected to provide resistance.
Note the levels of interest below:
- Pivot support is noted at 0.607, 0.6027, 0.595
- Pivot resistance is noted at 0.619, 0.6267, 0.631
| Levels | Levels.1 |
|---|---|
| Previous Daily High | 0.6223 |
| Previous Daily Low | 0.6103 |
| Previous Weekly High | 0.6277 |
| Previous Weekly Low | 0.6131 |
| Previous Monthly High | 0.6538 |
| Previous Monthly Low | 0.6131 |
| Daily Fibonacci 38.2% | 0.6149 |
| Daily Fibonacci 61.8% | 0.6177 |
| Daily Pivot Point S1 | 0.6070 |
| Daily Pivot Point S2 | 0.6027 |
| Daily Pivot Point S3 | 0.5950 |
| Daily Pivot Point R1 | 0.6190 |
| Daily Pivot Point R2 | 0.6267 |
| Daily Pivot Point R3 | 0.6310 |
[/s2If]
Join Our Telegram Group


