#XAGUSD @ 20.110 Silver bounces off a multi-month low set earlier this Wednesday, though lacks bullish conviction. (Pivot Orderbook analysis)
…
This is a premium post.
[s2If !current_user_can(access_s2member_level4)]Please register for PREMIUM VERSION HERE to read full post below containing analysis. In case of any error or you think you are not able to read the full post below, please email us at support#nehcap.com [lwa][/s2If] [s2If current_user_can(access_s2member_level4)]
- Silver bounces off a multi-month low set earlier this Wednesday, though lacks bullish conviction.
- Slightly oversold RSI turns out to be a key factor that prompts some intraday short-covering move.
- The technical setup still favours bearish traders and supports prospects for further near-term losses.
The pair currently trades last at 20.110.
The previous day high was 21.14 while the previous day low was 20.03. The daily 38.2% Fib levels comes at 20.46, expected to provide resistance. Similarly, the daily 61.8% fib level is at 20.72, expected to provide resistance.
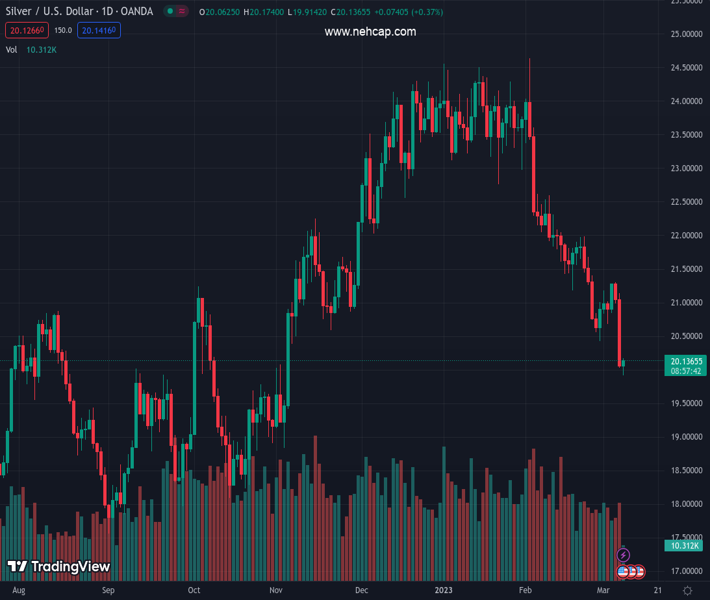
Silver shows some resilience below the $20.00 psychological mark and stages a modest recovery from its lowest level since early November touched earlier this Wednesday. The white metal sticks to its modest gains, around the $20.10-$20.15 area heading into the North American session, though any meaningful upside still seems elusive.
The intraday uptick could be solely attributed to some short-covering amid a slightly oversold Relative Strength Index (RSI) on the daily chart. That said, the overnight sustained break through the $20.50-$20.40 horizontal support, which coincided with the previous YTD low, was seen as a fresh trigger for bearish traders. Moreover, acceptance below a technically significant 200-day Simple Moving Average (SMA) supports prospects for an extension of the recent sharp pullback from the $24.65 area witnessed over the past month or so.
Some follow-through selling below the $20.00 mark will reaffirm the negative bias and pave the way for further losses. The XAG/USD could then slide to the $19.60 intermediate support before dropping to the $19.00 round figure. The downward trajectory could get extended towards the $18.80-$18.75 area en route to the next relevant support near the $18.30-$18.25 horizontal zone and the $18.00 level.
On the flip side, the $20.40-$20.50 support breakpoint now seems to act as an immediate strong resistance. Any further recovery is more likely to attract fresh sellers and remains capped near the 200-day SMA, currently pegged just ahead of the $21.00 mark. The latter should act as a pivotal point, which if cleared decisively might prompt some short-covering move and lift the XAG/USD towards the mid-$21.00s. Bulls might then aim back to reclaim the $22.00 round-figure mark.
Technical Levels: Supports and Resistances
XAGUSD currently trading at 20.08 at the time of writing. Pair opened at 20.08 and is trading with a change of 0.0 % .
| Overview | Overview.1 | |
|---|---|---|
| 0 | Today last price | 20.08 |
| 1 | Today Daily Change | 0.00 |
| 2 | Today Daily Change % | 0.00 |
| 3 | Today daily open | 20.08 |
The pair remains strongly bearish on the daily time frame. It trades below the 20 SMA @ 21.41, 50 SMA 22.73, 100 SMA @ 22.16 and 200 SMA @ 20.97.
| Trends | Trends.1 | |
|---|---|---|
| 0 | Daily SMA20 | 21.41 |
| 1 | Daily SMA50 | 22.73 |
| 2 | Daily SMA100 | 22.16 |
| 3 | Daily SMA200 | 20.97 |
The previous day high was 21.14 while the previous day low was 20.03. The daily 38.2% Fib levels comes at 20.46, expected to provide resistance. Similarly, the daily 61.8% fib level is at 20.72, expected to provide resistance.
Note the levels of interest below:
- Pivot support is noted at 19.7, 19.31, 18.59
- Pivot resistance is noted at 20.81, 21.53, 21.91
| Levels | Levels.1 |
|---|---|
| Previous Daily High | 21.14 |
| Previous Daily Low | 20.03 |
| Previous Weekly High | 21.27 |
| Previous Weekly Low | 20.42 |
| Previous Monthly High | 24.64 |
| Previous Monthly Low | 20.42 |
| Daily Fibonacci 38.2% | 20.46 |
| Daily Fibonacci 61.8% | 20.72 |
| Daily Pivot Point S1 | 19.70 |
| Daily Pivot Point S2 | 19.31 |
| Daily Pivot Point S3 | 18.59 |
| Daily Pivot Point R1 | 20.81 |
| Daily Pivot Point R2 | 21.53 |
| Daily Pivot Point R3 | 21.91 |
[/s2If]
Join Our Telegram Group


