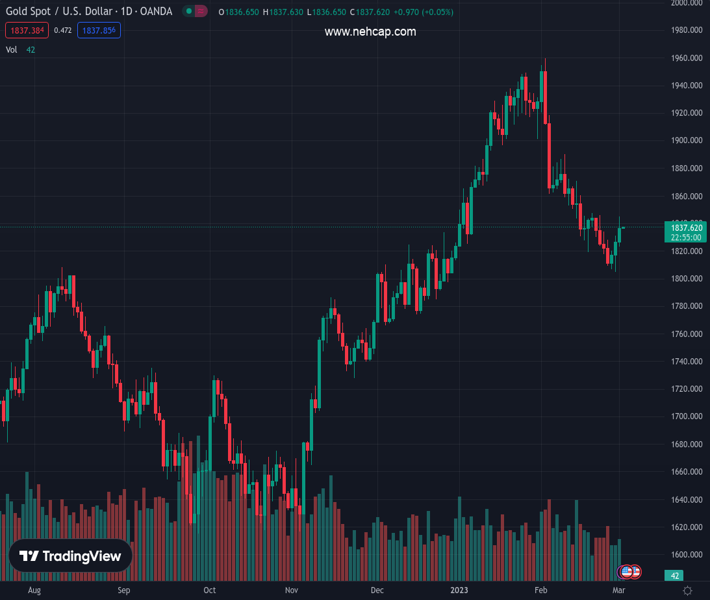
#XAUUSD @ 1,836.95 Gold price probes three-day winning streak with a retreat from one-week high., @nehcap view: Pullback expected (Pivot Orderbook analysis)
…
This is a premium post.
[s2If !current_user_can(access_s2member_level4)]Please register for PREMIUM VERSION HERE to read full post below containing analysis. In case of any error or you think you are not able to read the full post below, please email us at support#nehcap.com [lwa][/s2If] [s2If current_user_can(access_s2member_level4)]
- Gold price probes three-day winning streak with a retreat from one-week high.
- Softer US Dollar, China-inspired optimism favor XAU/USD buyers amid a lack of major United States data/events.
- US ISM Manufacturing PMI details, upbeat Treasury bond yields challenges Gold buyers.
The pair currently trades last at 1836.95.
The previous day high was 1831.23 while the previous day low was 1804.76. The daily 38.2% Fib levels comes at 1821.12, expected to provide support. Similarly, the daily 61.8% fib level is at 1814.87, expected to provide support.
Gold price (XAU/USD) retreat to $1,836, following a three-day rebound from a two-month low, as the metal buyers struggle to gain a major positive catalyst to back the latest run-up, especially amid upbeat United States data and Treasury bond yields. It’s worth noting, however, that the softer US Dollar and China-linked market optimism puts a floor under the XAU/USD price amid a lack of major data/events.
Gold price pares recent gains while easing from the short-term key technical hurdle surrounding $1,845 after the United States ISM Manufacturing PMI details renew inflation fears. That said, the headline gauge rose to 47.7 from 47.4 prior, versus the 48.0 expected. However, the details were quite interesting as Prices Paid and New Orders marked the highest figures in five and four months respectively.
On the other hand, the US 10-year Treasury bond yields rose to the highest levels since early November 2022 by poking the 4.0% mark whereas the two-year counterpart rallied to the June 2007 levels by piercing the 4.90% mark. The jump in the US Treasury bond yields suggests the market’s fears of inflation and recession, which in turn underpin the hopes of the US Dollar rebound and the pullback of the XAU/USD.
Amid the upbeat data and strong yields, the Minneapolis Federal Reserve (Fed) President Neel Kashkari reiterated on Wednesday that inflation in the US is still very high and that their job is to bring it down, as reported by Reuters. “Wage growth is now too high to be consistent with 2% inflation,” Kashkari added and noted that it is concerning that the Federal Reserve’s rate hikes so far have not brought down services inflation.
Although the Gold buyers seem to fade the momentum due to the latest swing in the US data and the hawkish Federal Reserve talks, not to forget upbeat yields, the XAU/USD sellers are off the table as the US Dollar remains weak and China flashes signs of a rebound.
That said, the US Dollar Index (DXY) began March on a back foot after posting the biggest monthly gain since September 2022, with a daily loss of nearly half a percent while poking the 104.40 level at the latest.
Elsewhere, strong prints of China’s Caixin and NBS Manufacturing PMIs for February join the Non-Manufacturing PMI for the said month to mark an upbeat economic rebound in the world’s biggest industrial player. Following the data, China Finance Minister Liu He showed readiness to bolster the nation’s fiscal spending while also mentioning that the foundation of China’s economic recovery is still not stable.
Moving on, the Gold price may witness further consolidation of the recent gains amid a light economic calendar in the United States. However, scheduled readings of the Eurozone inflation data and risk catalysts surrounding China and Russia may keep entertaining the XAU/USD traders.
Gold price struggles to justify the previous day’s descending channel breakout as it retreats from the 61.8% Fibonacci retracement level of its up-move from December 2022 to February 2023, as well as the 100-bar Simple Moving Average (SMA).
The pullback move also gained support from the Relative Strength Index (RSI) line, placed at 14, as it hit the overbought territory.
Hence, a pullback towards the previous resistance line of a one-month-old bearish channel’s top line, close to $1,821 appears imminent.
However, bullish signals from the Moving Average Convergence and Divergence (MACD) indicator and multiple supports around $1,800 and $1,780 challenge the XAU/USD past $1,821.
Meanwhile, a convergence of the 100-SMA and the 61.8% Fibonacci retracement, also known as the “Golden Fibonacci ratio”, around $1,842-45, restrict the immediate run-up of the Gold price.
Following that, the 200-SMA hurdle of $1,880 appears the last defense of the Gold bears.
Hence, Gold price is likely to decline further but the downside room seems limited.
Trend: Pullback expected
Technical Levels: Supports and Resistances
XAUUSD currently trading at 1836.74 at the time of writing. Pair opened at 1826.57 and is trading with a change of 0.56% % .
| Overview | Overview.1 | |
|---|---|---|
| 0 | Today last price | 1836.74 |
| 1 | Today Daily Change | 10.17 |
| 2 | Today Daily Change % | 0.56% |
| 3 | Today daily open | 1826.57 |
The pair is trading below its 20 Daily moving average @ 1853.82, below its 50 Daily moving average @ 1866.14 , above its 100 Daily moving average @ 1795.44 and above its 200 Daily moving average @ 1775.63
| Trends | Trends.1 | |
|---|---|---|
| 0 | Daily SMA20 | 1853.82 |
| 1 | Daily SMA50 | 1866.14 |
| 2 | Daily SMA100 | 1795.44 |
| 3 | Daily SMA200 | 1775.63 |
The previous day high was 1831.23 while the previous day low was 1804.76. The daily 38.2% Fib levels comes at 1821.12, expected to provide support. Similarly, the daily 61.8% fib level is at 1814.87, expected to provide support.
Note the levels of interest below:
- Pivot support is noted at 1810.48, 1794.38, 1784.01
- Pivot resistance is noted at 1836.95, 1847.32, 1863.42
| Levels | Levels.1 |
|---|---|
| Previous Daily High | 1831.23 |
| Previous Daily Low | 1804.76 |
| Previous Weekly High | 1847.59 |
| Previous Weekly Low | 1808.99 |
| Previous Monthly High | 1959.80 |
| Previous Monthly Low | 1804.76 |
| Daily Fibonacci 38.2% | 1821.12 |
| Daily Fibonacci 61.8% | 1814.87 |
| Daily Pivot Point S1 | 1810.48 |
| Daily Pivot Point S2 | 1794.38 |
| Daily Pivot Point S3 | 1784.01 |
| Daily Pivot Point R1 | 1836.95 |
| Daily Pivot Point R2 | 1847.32 |
| Daily Pivot Point R3 | 1863.42 |
[/s2If]
Join Our Telegram Group


