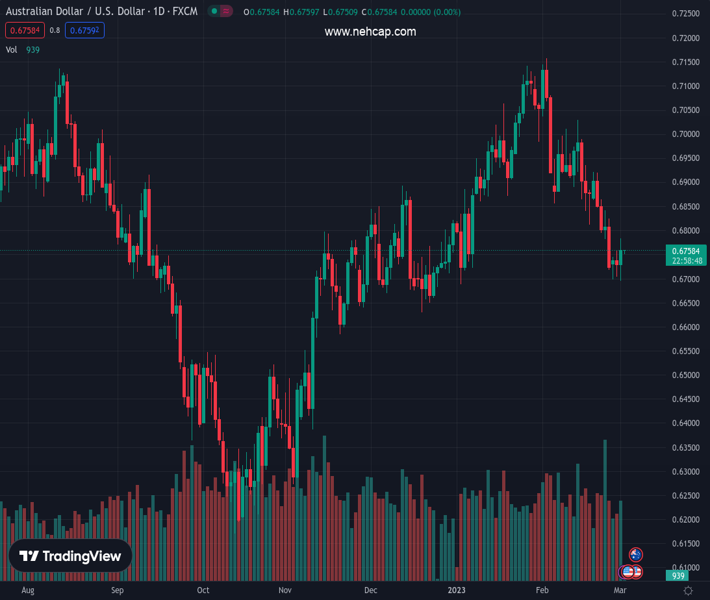
#AUDUSD @ 0.67562 struggles to defend the previous day’s rebound from a two-month low, grinds higher of late. (Pivot Orderbook analysis)
…
This is a premium post.
[s2If !current_user_can(access_s2member_level4)]Please register for PREMIUM VERSION HERE to read full post below containing analysis. In case of any error or you think you are not able to read the full post below, please email us at support#nehcap.com [lwa][/s2If] [s2If current_user_can(access_s2member_level4)]
- AUD/USD struggles to defend the previous day’s rebound from a two-month low, grinds higher of late.
- Downbeat Aussie data contrasts with China-inspired optimism to challenge bulls.
- Softer US Dollar allowed Aussie buyers to begin March on a positive note.
- Strong US Treasury bond yields, mixed US data appears a challenge for the bulls.
The pair currently trades last at 0.67562.
The previous day high was 0.6758 while the previous day low was 0.6704. The daily 38.2% Fib levels comes at 0.6724, expected to provide support. Similarly, the daily 61.8% fib level is at 0.6737, expected to provide support.
AUD/USD remains sidelined around 0.6755 as traders await more signals to back the latest rebound from a two-month low during early Thursday morning in Asia. In doing so, the Aussie pair struggles to justify the softer US Dollar and China-linked market optimism amid strong US Treasury bond yields and mostly upbeat US data.
That said, the Aussie pair managed to reverse the Aussie GDP and inflation-induced pessimism after strong China activity data for February. The risk barometer pair also benefited from China Finance Minister Liu He’s comments as he showed readiness to bolster the nation’s fiscal spending. The policymaker also mentioned that the foundation of China’s economic recovery is still not stable and challenges the AUD/USD bulls afterward.
Elsewhere, US ISM Manufacturing PMI details renew inflation fears as the headline gauge rose to 47.7 from 47.4 prior, versus the 48.0 expected but the Prices Paid and New Orders marked the highest figures in five and four months respectively.
Ahead of the data, Minneapolis Federal Reserve (Fed) President Neel Kashkari said, “Wage growth is now too high to be consistent with 2% inflation.” The policymaker also added and noted that it is concerning that the Federal Reserve’s rate hikes so far have not brought down service inflation.
It should be observed the US 10-year Treasury bond yields rose to the highest levels since early November 2022 by poking the 4.0% mark whereas the two-year counterpart rallied to the June 2007 levels by piercing the 4.90% mark. The jump in the US Treasury bond yields suggests the market’s fears of inflation and recession, which in turn challenge the risk-barometer AUD/USD pair. That said, Wall Street closed mixed while the S&P 500 Futures struggled for clear directions of late.
Looking forward, Australia’s Building Permits for January may offer immediate direction ahead of the US Weekly Initial Jobless Claims. However, major attention will be on Friday’s US ISM Services PMI amid fears of strong services inflation.
Unless crossing a convergence of the one-month-old descending resistance line and the 200-DMA, around 0.6795, as well as staying beyond the 0.6800 round figure, the AUD/USD bulls are off the table.
Technical Levels: Supports and Resistances
AUDUSD currently trading at 0.6755 at the time of writing. Pair opened at 0.6726 and is trading with a change of 0.43% % .
| Overview | Overview.1 | |
|---|---|---|
| 0 | Today last price | 0.6755 |
| 1 | Today Daily Change | 0.0029 |
| 2 | Today Daily Change % | 0.43% |
| 3 | Today daily open | 0.6726 |
The pair is trading below its 20 Daily moving average @ 0.6898, below its 50 Daily moving average @ 0.6895 , above its 100 Daily moving average @ 0.6735 and below its 200 Daily moving average @ 0.6797
| Trends | Trends.1 | |
|---|---|---|
| 0 | Daily SMA20 | 0.6898 |
| 1 | Daily SMA50 | 0.6895 |
| 2 | Daily SMA100 | 0.6735 |
| 3 | Daily SMA200 | 0.6797 |
The previous day high was 0.6758 while the previous day low was 0.6704. The daily 38.2% Fib levels comes at 0.6724, expected to provide support. Similarly, the daily 61.8% fib level is at 0.6737, expected to provide support.
Note the levels of interest below:
- Pivot support is noted at 0.6701, 0.6676, 0.6647
- Pivot resistance is noted at 0.6754, 0.6783, 0.6808
| Levels | Levels.1 |
|---|---|
| Previous Daily High | 0.6758 |
| Previous Daily Low | 0.6704 |
| Previous Weekly High | 0.6921 |
| Previous Weekly Low | 0.6719 |
| Previous Monthly High | 0.7158 |
| Previous Monthly Low | 0.6698 |
| Daily Fibonacci 38.2% | 0.6724 |
| Daily Fibonacci 61.8% | 0.6737 |
| Daily Pivot Point S1 | 0.6701 |
| Daily Pivot Point S2 | 0.6676 |
| Daily Pivot Point S3 | 0.6647 |
| Daily Pivot Point R1 | 0.6754 |
| Daily Pivot Point R2 | 0.6783 |
| Daily Pivot Point R3 | 0.6808 |
[/s2If]
Join Our Telegram Group


