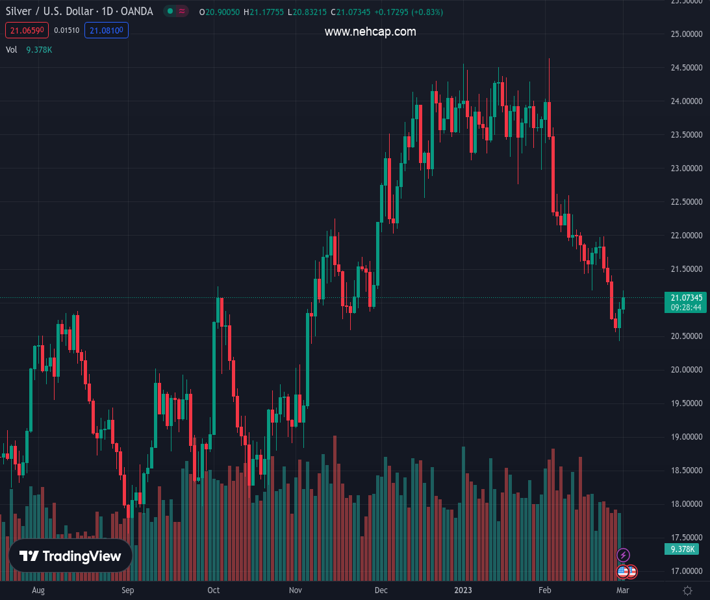
#XAGUSD @ 21.069 Siler gains traction for the second straight day and recovers further from the YTD low. (Pivot Orderbook analysis)
…
This is a premium post.
[s2If !current_user_can(access_s2member_level4)]Please register for PREMIUM VERSION HERE to read full post below containing analysis. In case of any error or you think you are not able to read the full post below, please email us at support#nehcap.com [lwa][/s2If] [s2If current_user_can(access_s2member_level4)]
- Siler gains traction for the second straight day and recovers further from the YTD low.
- The setup favours bearish traders and supports prospects for further near-term losses.
- A sustained strength beyond the $22.00 confluence could negate the negative outlook.
The pair currently trades last at 21.069.
The previous day high was 21.01 while the previous day low was 20.42. The daily 38.2% Fib levels comes at 20.78, expected to provide support. Similarly, the daily 61.8% fib level is at 20.64, expected to provide support.
Silver builds on the previous day’s recovery move from the $20.40 area, or a nearly four-month low and scales higher for the second successive day on Wednesday. The white metal, however, trims a part of its intraday gains and trades around the $21.00 mark, still up nearly 0.50% for the day heading into the North American session.
Looking at the broader picture, the XAG/USD on Tuesday showed some resilience below the 61.8% Fibonacci retracement level of the recent rally from the October 2022 low. The said support, around the $20.60 area, should now act as a pivotal point. Given that technical indicators on the daily chart have recovered from the oversold zone and are still holding deep in the negative territory, the bias still seems tilted in favour of bearish traders.
Hence, the ongoing recovery move is more likely to confront stiff resistance near 50% Fibo. level, around the $21.35 region, ahead of the mid-$21.00s. Any subsequent strength could be seen as a selling opportunity and runs the risk of fizzling out near the $22.00 confluence support breakpoint. The said handle comprises 100-day Simple Moving Average (SMA) and 38.2% Fibo. level, which if cleared could negate the near-term bearish bias.
A sustained strength beyond could trigger a short-covering rally and lift the XAG/USD towards the $22.55-$22.60 supply zone. Bulls might eventually aim to reclaim the $23.00 round-figure mark, which coincides with the 23.6% Fibo. level.
On the flip side, 61.8% Fibo. level, around the $20.60 area, now seems to protect the immediate downside. Some follow-through selling below the overnight swing low, around the $20.40 region, should make the XAG/USD vulnerable to weaken further. The downward trajectory should pave the way for a fall below the $20.00 psychological mark, towards testing the next relevant support near the $19.75-$19.70 region.
Technical Levels: Supports and Resistances
XAGUSD currently trading at 21.02 at the time of writing. Pair opened at 20.91 and is trading with a change of 0.53 % .
| Overview | Overview.1 | |
|---|---|---|
| 0 | Today last price | 21.02 |
| 1 | Today Daily Change | 0.11 |
| 2 | Today Daily Change % | 0.53 |
| 3 | Today daily open | 20.91 |
The pair is trading below its 20 Daily moving average @ 21.91, below its 50 Daily moving average @ 23.03 , below its 100 Daily moving average @ 22.05 and above its 200 Daily moving average @ 21.0
| Trends | Trends.1 | |
|---|---|---|
| 0 | Daily SMA20 | 21.91 |
| 1 | Daily SMA50 | 23.03 |
| 2 | Daily SMA100 | 22.05 |
| 3 | Daily SMA200 | 21.00 |
The previous day high was 21.01 while the previous day low was 20.42. The daily 38.2% Fib levels comes at 20.78, expected to provide support. Similarly, the daily 61.8% fib level is at 20.64, expected to provide support.
Note the levels of interest below:
- Pivot support is noted at 20.55, 20.19, 19.96
- Pivot resistance is noted at 21.14, 21.36, 21.72
| Levels | Levels.1 |
|---|---|
| Previous Daily High | 21.01 |
| Previous Daily Low | 20.42 |
| Previous Weekly High | 21.98 |
| Previous Weekly Low | 20.74 |
| Previous Monthly High | 24.64 |
| Previous Monthly Low | 20.42 |
| Daily Fibonacci 38.2% | 20.78 |
| Daily Fibonacci 61.8% | 20.64 |
| Daily Pivot Point S1 | 20.55 |
| Daily Pivot Point S2 | 20.19 |
| Daily Pivot Point S3 | 19.96 |
| Daily Pivot Point R1 | 21.14 |
| Daily Pivot Point R2 | 21.36 |
| Daily Pivot Point R3 | 21.72 |
[/s2If]
Join Our Telegram Group


