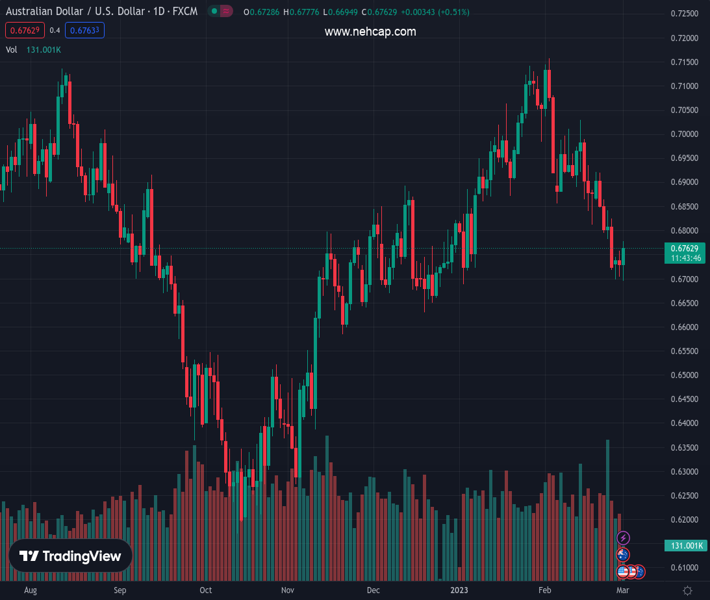
#AUDUSD @ 0.67596 shows resilience below the 0.6700 mark and rebounds from a nearly two-month low. (Pivot Orderbook analysis)
…
This is a premium post.
[s2If !current_user_can(access_s2member_level4)]Please register for PREMIUM VERSION HERE to read full post below containing analysis. In case of any error or you think you are not able to read the full post below, please email us at support#nehcap.com [lwa][/s2If] [s2If current_user_can(access_s2member_level4)]
- AUD/USD shows resilience below the 0.6700 mark and rebounds from a nearly two-month low.
- The upbeat Chinese PMI prints benefit the Australian Dollar amid a sharp intraday USD downfall.
- Looming recession risks, hawkish Fed expectations to act as a tailwind for the USD and cap gains.
The pair currently trades last at 0.67596.
The previous day high was 0.6758 while the previous day low was 0.6704. The daily 38.2% Fib levels comes at 0.6724, expected to provide support. Similarly, the daily 61.8% fib level is at 0.6737, expected to provide support.
The AUD/USD pair stages a recovery from sub-0.6700 levels, or a nearly two-month low touched earlier this Wednesday and scales higher through the first half of the European session. The momentum lifts spot prices to a fresh weekly high, around the 0.6775-0.6780 region in the last hour, with bulls now eyeing to test the 200-day Simple Moving Average (SMA) support breakpoint.
The upbeat Chinese data benefits the China-proxy Australian Dollar and prompt aggressive short-covering around the AUD/USD pair amid a sharp intraday US Dollar downfall. In fact, the official Chinese PMI prints for February indicated that business activity in the country rose to pre-COVID levels and that recovery in the world’s second-largest economy is gaining steam. This largely offsets the softer-than-expected Australian macro data.
The Australian Bureau of Statistics reported that the economy expanded by 0.5% in the three months to December, lower than the 0.8% expected and 0.6% in the previous quarter. On an annualized basis, fourth quarter GDP rose 2.7%, as expected, though marked a significant slowdown from the 5.9% growth recorded in the previous quarter. Another report showed that Consumer Price Index (CPI) missed market estimates and decelerated from 8.4% to 7.4% in January.
The latest optimism, meanwhile, leads to a modest recovery in the global risk sentiment and weighs heavily on the safe-haven Greenback. This, in turn, is seen as another factor pushing the AUD/USD pair higher, though hawkish Fed expectations and looming recession risks could keep a lid on any further gains. The markets seem convinced that the Federal Reserve will stick to its hawkish stance for longer in the wake of stubbornly high inflation.
This remains supportive of elevated US Treasury bond yields and supports prospects for the emergence of some USD dip-buying. Furthermore, investors remain worried about economic headwinds stemming from rapidly rising borrowing costs. Adding to this, geopolitical tensions should cap any optimism in the markets and cap the risk-sensitive Aussie. This, in turn, warrants some caution before confirming that the pair has formed a near-term bottom.
Market participants now look to the US economic docket, featuring the release of the ISM Manufacturing PMI later during the early North American session. This, along with the US bond yields and the broader risk sentiment, should influence the USD price dynamics and allow traders to grab short-term opportunities around the AUD/USD pair.
Technical Levels: Supports and Resistances
AUDUSD currently trading at 0.6764 at the time of writing. Pair opened at 0.6726 and is trading with a change of 0.56 % .
| Overview | Overview.1 | |
|---|---|---|
| 0 | Today last price | 0.6764 |
| 1 | Today Daily Change | 0.0038 |
| 2 | Today Daily Change % | 0.5600 |
| 3 | Today daily open | 0.6726 |
The pair is trading below its 20 Daily moving average @ 0.6898, below its 50 Daily moving average @ 0.6895 , above its 100 Daily moving average @ 0.6735 and below its 200 Daily moving average @ 0.6797
| Trends | Trends.1 | |
|---|---|---|
| 0 | Daily SMA20 | 0.6898 |
| 1 | Daily SMA50 | 0.6895 |
| 2 | Daily SMA100 | 0.6735 |
| 3 | Daily SMA200 | 0.6797 |
The previous day high was 0.6758 while the previous day low was 0.6704. The daily 38.2% Fib levels comes at 0.6724, expected to provide support. Similarly, the daily 61.8% fib level is at 0.6737, expected to provide support.
Note the levels of interest below:
- Pivot support is noted at 0.6701, 0.6676, 0.6647
- Pivot resistance is noted at 0.6754, 0.6783, 0.6808
| Levels | Levels.1 |
|---|---|
| Previous Daily High | 0.6758 |
| Previous Daily Low | 0.6704 |
| Previous Weekly High | 0.6921 |
| Previous Weekly Low | 0.6719 |
| Previous Monthly High | 0.7158 |
| Previous Monthly Low | 0.6698 |
| Daily Fibonacci 38.2% | 0.6724 |
| Daily Fibonacci 61.8% | 0.6737 |
| Daily Pivot Point S1 | 0.6701 |
| Daily Pivot Point S2 | 0.6676 |
| Daily Pivot Point S3 | 0.6647 |
| Daily Pivot Point R1 | 0.6754 |
| Daily Pivot Point R2 | 0.6783 |
| Daily Pivot Point R3 | 0.6808 |
[/s2If]
Join Our Telegram Group


