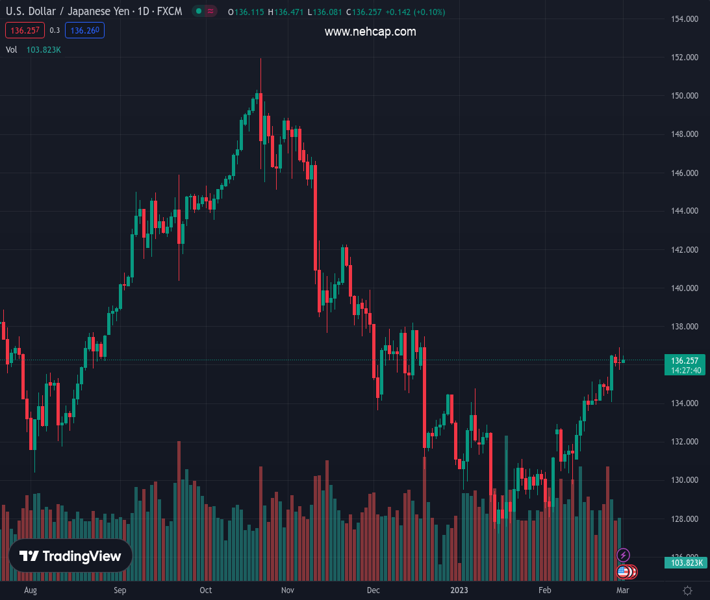
#USDJPY @ 136.255 struggles to capitalize on a modest uptick on Wednesday and remains below the YTD top. (Pivot Orderbook analysis)
…
This is a premium post.
[s2If !current_user_can(access_s2member_level4)]Please register for PREMIUM VERSION HERE to read full post below containing analysis. In case of any error or you think you are not able to read the full post below, please email us at support#nehcap.com [lwa][/s2If] [s2If current_user_can(access_s2member_level4)]
- USD/JPY struggles to capitalize on a modest uptick on Wednesday and remains below the YTD top.
- The BoJ’s dovish outlook, weaker Japanese PMI undermine the JPY and continue to lend support.
- Hawkish Fed expectations, elevated US bond yields act as a tailwind for the USD and favour bulls.
The pair currently trades last at 136.255.
The previous day high was 136.92 while the previous day low was 135.73. The daily 38.2% Fib levels comes at 136.19, expected to provide support. Similarly, the daily 61.8% fib level is at 136.47, expected to provide resistance.
The USD/JPY pair edges higher following the previous day’s two-way price swings and trades with a mild positive bias through the early European session. The pair is currently placed below mid-136.00s and remains well within the striking distance of its highest level since December 20 touched on Tuesday.
A combination of factors undermines the Japanese Yen (JPY), which, in turn, acts as a tailwind for the USD/JPY pair amid the underlying bullish sentiment surrounding the US Dollar. Data released earlier this Wednesday showed that Japan’s manufacturing sector remained in contraction territory in February. This comes on the back of dovish comments from the incoming Bank of Japan (BoJ) Governor Kazuo Ueda and Deputy Governor nominee Shinichi Uchida, stressing the need to maintain the ultra-loose monetary policy. This, along with signs of stability in the equity markets weigh on the safe-haven JPY.
The USD, on the other hand, remains pinned near a multi-week high amid firming expectations for further policy tightening by the Fed and lends additional support to the USD/JPY pair. In fact, the markets now seem convinced that the US central bank will have to raise interest rates for longer to tame stubbornly high inflation. This remains supportive of elevated US Treasury bond yields and continues to act as a tailwind for the Greenback. That said, indications that the Fed’s rate hikes were beginning to have their intended effect of cooling the economy seem to cap any meaningful gains for the buck.
Investors remain worried about economic headwinds stemming from rapidly rising borrowing costs. The fears were fueled by Tuesday’s disappointing release of the Conference Board’s US Consumer Confidence Index, which fell to 102.9 in February from 106 in the previous month. Furthermore, the Chicago PMI business survey for February also came in weaker-than-expected and dropped to 43.6 in February, marking the sixth straight month in contraction territory. The Richmond Fed also released its survey of manufacturing activity for February and reported a decline to -16 from -11 in January 2023.
The aforementioned mixed fundamental backdrop is holding back traders from placing aggressive bets and keeping a lid on any meaningful gains for the USD/JPY pair, at least for the time being. Market participants now look to the US economic docket, featuring the release of ISM Manufacturing PMI later during the early North American session. This, along with the US bond yields, will influence the USD price dynamics and provide some impetus to the USD/JPY pair. Apart from this, traders will take cues from the broader risk sentiment to grab short-term opportunities around the major.
Technical Levels: Supports and Resistances
USDJPY currently trading at 136.33 at the time of writing. Pair opened at 136.14 and is trading with a change of 0.14 % .
| Overview | Overview.1 | |
|---|---|---|
| 0 | Today last price | 136.33 |
| 1 | Today Daily Change | 0.19 |
| 2 | Today Daily Change % | 0.14 |
| 3 | Today daily open | 136.14 |
The pair is trading above its 20 Daily moving average @ 133.1, above its 50 Daily moving average @ 131.86 , below its 100 Daily moving average @ 136.97 and below its 200 Daily moving average @ 137.18
| Trends | Trends.1 | |
|---|---|---|
| 0 | Daily SMA20 | 133.10 |
| 1 | Daily SMA50 | 131.86 |
| 2 | Daily SMA100 | 136.97 |
| 3 | Daily SMA200 | 137.18 |
The previous day high was 136.92 while the previous day low was 135.73. The daily 38.2% Fib levels comes at 136.19, expected to provide support. Similarly, the daily 61.8% fib level is at 136.47, expected to provide resistance.
Note the levels of interest below:
- Pivot support is noted at 135.61, 135.08, 134.42
- Pivot resistance is noted at 136.79, 137.45, 137.98
| Levels | Levels.1 |
|---|---|
| Previous Daily High | 136.92 |
| Previous Daily Low | 135.73 |
| Previous Weekly High | 136.52 |
| Previous Weekly Low | 133.92 |
| Previous Monthly High | 136.92 |
| Previous Monthly Low | 128.08 |
| Daily Fibonacci 38.2% | 136.19 |
| Daily Fibonacci 61.8% | 136.47 |
| Daily Pivot Point S1 | 135.61 |
| Daily Pivot Point S2 | 135.08 |
| Daily Pivot Point S3 | 134.42 |
| Daily Pivot Point R1 | 136.79 |
| Daily Pivot Point R2 | 137.45 |
| Daily Pivot Point R3 | 137.98 |
[/s2If]
Join Our Telegram Group


