#USDCAD @ 1.36135 takes offers to renew intraday low, reverses from “double top”., @nehcap view: Limited downside expected (Pivot Orderbook analysis)
…
This is a premium post.
[s2If !current_user_can(access_s2member_level4)]Please register for PREMIUM VERSION HERE to read full post below containing analysis. In case of any error or you think you are not able to read the full post below, please email us at support#nehcap.com [lwa][/s2If] [s2If current_user_can(access_s2member_level4)]
- USD/CAD takes offers to renew intraday low, reverses from “double top”.
- 100-HMA, two-week-old ascending trend line restrict immediate downside.
- RSI’s pullback from overbought territory, bearish MACD signals favor sellers.
- 200-HMA, 1.3530 act as crucial supports for Loonie pair bears to watch.
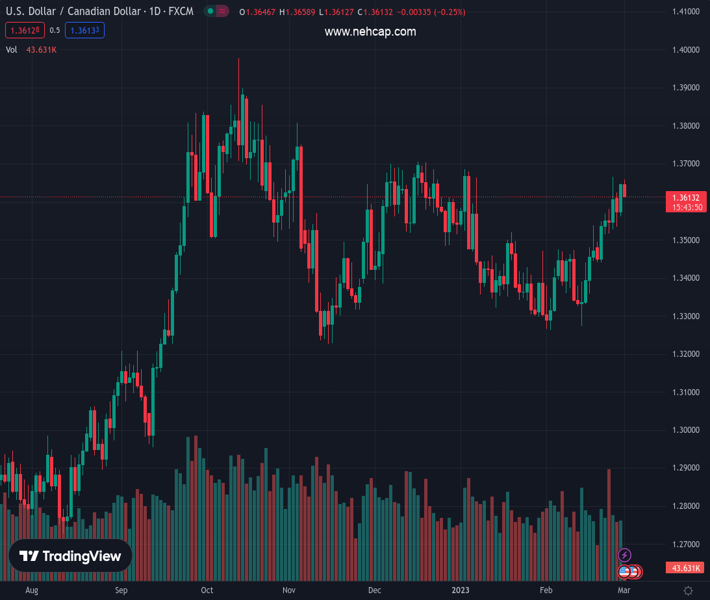
The pair currently trades last at 1.36135.
The previous day high was 1.3646 while the previous day low was 1.3561. The daily 38.2% Fib levels comes at 1.3614, expected to provide resistance. Similarly, the daily 61.8% fib level is at 1.3593, expected to provide support.
USD/CAD welcomes March with a bearish bias as it renews its intraday low near 1.3620 during early Wednesday morning in Europe. That said, the Loonie pair marked the biggest daily gain in a week the previous day, as well as posted the heaviest monthly jump since September 2022 by the end of February.
The quote’s latest pullback could be linked to its inability to cross the late February swing high of 1.3665. In doing so, the pair portrays the double top around 1.3660-65 region.
The chart formation also takes clues from the bearish MACD signals to lure sellers. On the same line could be the RSI (14) pullback from the overbought territory.
Hence, the USD/CAD pair is likely to register further downside. However, a convergence of the 100-Hour Moving Average (HMA) and an upward-sloping support line from mid-February, near 1.3580, appears a tough nut to crack for the bears.
Also adding to the downside filter are the 200-HMA and the weekly low, respectively near 1.3540 and 1.3530.
In a case where the USD/CAD drops below 1.3530 support, the pair confirms the bearish “double top” chart formation, which in turn suggests the theoretical fall towards 1.3400.
Alternatively, a sustained break of the 1.3660-65 hurdle could aim for January’s peak of 1.3685 and the last December’s high near 1.3700 before allowing the USD/CAD bulls a free zone to rule.
Trend: Limited downside expected
Technical Levels: Supports and Resistances
USDCAD currently trading at 1.362 at the time of writing. Pair opened at 1.3646 and is trading with a change of -0.19% % .
| Overview | Overview.1 | |
|---|---|---|
| 0 | Today last price | 1.362 |
| 1 | Today Daily Change | -0.0026 |
| 2 | Today Daily Change % | -0.19% |
| 3 | Today daily open | 1.3646 |
The pair remains strongly bullish on the daily timeframe. It trades above its 20 SMA @ 1.3451, 50 SMA 1.346, 100 SMA @ 1.3508 and 200 SMA @ 1.3272.
| Trends | Trends.1 | |
|---|---|---|
| 0 | Daily SMA20 | 1.3451 |
| 1 | Daily SMA50 | 1.3460 |
| 2 | Daily SMA100 | 1.3508 |
| 3 | Daily SMA200 | 1.3272 |
The previous day high was 1.3646 while the previous day low was 1.3561. The daily 38.2% Fib levels comes at 1.3614, expected to provide resistance. Similarly, the daily 61.8% fib level is at 1.3593, expected to provide support.
Note the levels of interest below:
- Pivot support is noted at 1.3589, 1.3532, 1.3504
- Pivot resistance is noted at 1.3674, 1.3703, 1.376
| Levels | Levels.1 |
|---|---|
| Previous Daily High | 1.3646 |
| Previous Daily Low | 1.3561 |
| Previous Weekly High | 1.3666 |
| Previous Weekly Low | 1.3441 |
| Previous Monthly High | 1.3666 |
| Previous Monthly Low | 1.3262 |
| Daily Fibonacci 38.2% | 1.3614 |
| Daily Fibonacci 61.8% | 1.3593 |
| Daily Pivot Point S1 | 1.3589 |
| Daily Pivot Point S2 | 1.3532 |
| Daily Pivot Point S3 | 1.3504 |
| Daily Pivot Point R1 | 1.3674 |
| Daily Pivot Point R2 | 1.3703 |
| Daily Pivot Point R3 | 1.3760 |
[/s2If]
Join Our Telegram Group


