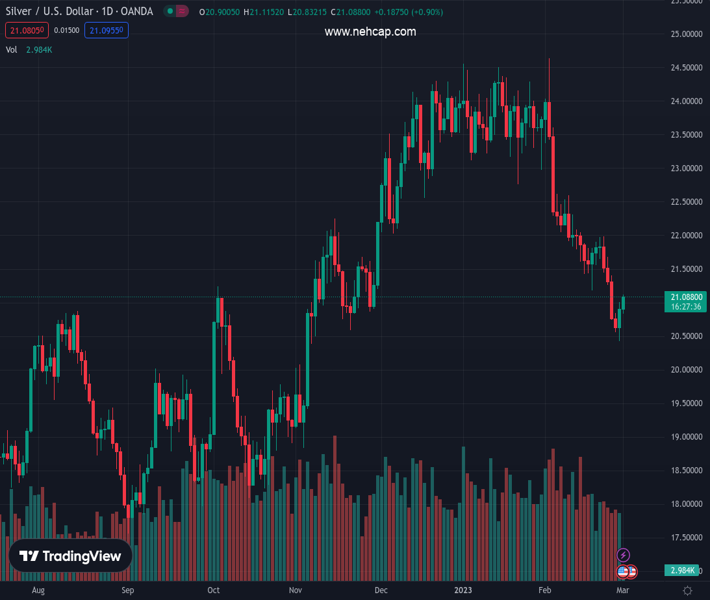
#XAGUSD @ 21.0765 Silver price extends the previous day’s recovery from the lowest levels since early November 2022., @nehcap view: Limited upside expected (Pivot Orderbook analysis)
…
This is a premium post.
[s2If !current_user_can(access_s2member_level4)]Please register for PREMIUM VERSION HERE to read full post below containing analysis. In case of any error or you think you are not able to read the full post below, please email us at support#nehcap.com [lwa][/s2If] [s2If current_user_can(access_s2member_level4)]
- Silver price extends the previous day’s recovery from the lowest levels since early November 2022.
- Sustained break of 100-HMA, bullish MACD signals and ascending trend channel keep buyers hopeful.
- Overbought RSI conditions challenge XAG/USD run-up past $21.20 hurdle, 200-HMA act as additional upside filter.
The pair currently trades last at 21.0765.
The previous day high was 21.01 while the previous day low was 20.42. The daily 38.2% Fib levels comes at 20.78, expected to provide support. Similarly, the daily 61.8% fib level is at 20.64, expected to provide support.
Silver price (XAG/USD) remains firmer around $21.10 as bulls extend the previous day’s rebound from the multi-day low during early Wednesday. In doing so, the bright metal marches with a two-day-old ascending trend channel while justifying the bullish MACD signals.
However, the overbought conditions of the RSI (14) join multiple technical hurdles around $21.20 to challenge the metal’s further upside momentum. Among the key resistances, the February 17 swing low and the 50% Fibonacci retracement level of the pair’s February 22-28 fall gain major attention. Also challenging the buyers is the upper line of the stated bullish channel.
Even if the XAG/USD rises past $21.20, the 200-Hour Moving Average (HMA) could challenge bullion buyers near $21.35.
Following that, a north-run towards the late February swing high near $22.00 can’t be ruled out.
On the contrary, a downside break of the 100-HMA, around $21.00 by the press time, could challenge the nearby bullish chart formation by poking the $20.90 support.
Should the quote successfully defies the ascending trend channel, the previous monthly low near $20.40 and the $20.00 psychological magnet will gain the market’s attention.
To sum up, the Silver price is likely to remain in recovery mode but the upside room appears limited.
Trend: Limited upside expected
Technical Levels: Supports and Resistances
XAGUSD currently trading at 21.07 at the time of writing. Pair opened at 20.91 and is trading with a change of 0.77% % .
| Overview | Overview.1 | |
|---|---|---|
| 0 | Today last price | 21.07 |
| 1 | Today Daily Change | 0.16 |
| 2 | Today Daily Change % | 0.77% |
| 3 | Today daily open | 20.91 |
The pair is trading below its 20 Daily moving average @ 21.91, below its 50 Daily moving average @ 23.03 , below its 100 Daily moving average @ 22.05 and above its 200 Daily moving average @ 21.0
| Trends | Trends.1 | |
|---|---|---|
| 0 | Daily SMA20 | 21.91 |
| 1 | Daily SMA50 | 23.03 |
| 2 | Daily SMA100 | 22.05 |
| 3 | Daily SMA200 | 21.00 |
The previous day high was 21.01 while the previous day low was 20.42. The daily 38.2% Fib levels comes at 20.78, expected to provide support. Similarly, the daily 61.8% fib level is at 20.64, expected to provide support.
Note the levels of interest below:
- Pivot support is noted at 20.55, 20.19, 19.96
- Pivot resistance is noted at 21.14, 21.36, 21.72
| Levels | Levels.1 |
|---|---|
| Previous Daily High | 21.01 |
| Previous Daily Low | 20.42 |
| Previous Weekly High | 21.98 |
| Previous Weekly Low | 20.74 |
| Previous Monthly High | 24.64 |
| Previous Monthly Low | 20.42 |
| Daily Fibonacci 38.2% | 20.78 |
| Daily Fibonacci 61.8% | 20.64 |
| Daily Pivot Point S1 | 20.55 |
| Daily Pivot Point S2 | 20.19 |
| Daily Pivot Point S3 | 19.96 |
| Daily Pivot Point R1 | 21.14 |
| Daily Pivot Point R2 | 21.36 |
| Daily Pivot Point R3 | 21.72 |
[/s2If]
Join Our Telegram Group


