#USDJPY @ 136.368 picks up bids to snap two-day downtrend around 10-week high., @nehcap view: Limited upside expected (Pivot Orderbook analysis)
…
This is a premium post.
[s2If !current_user_can(access_s2member_level4)]Please register for PREMIUM VERSION HERE to read full post below containing analysis. In case of any error or you think you are not able to read the full post below, please email us at support#nehcap.com [lwa][/s2If] [s2If current_user_can(access_s2member_level4)]
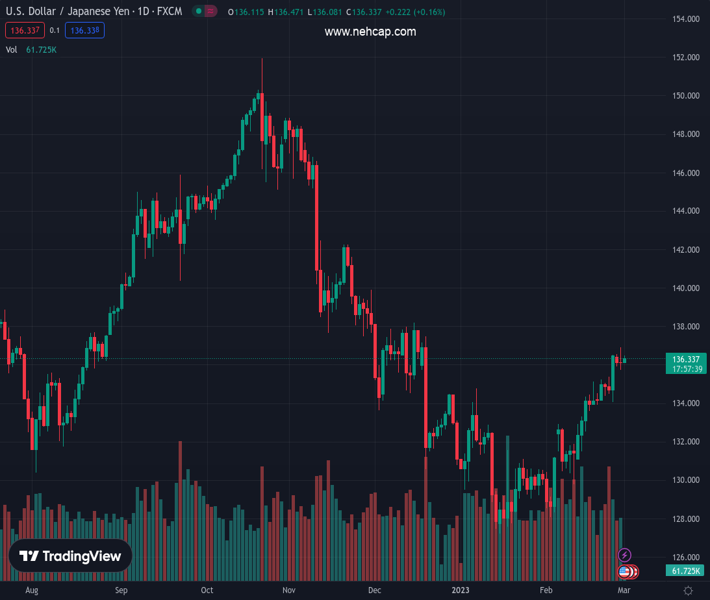
- USD/JPY picks up bids to snap two-day downtrend around 10-week high.
- Bullish MACD signals, sustained trading beyond two-week-old support line keep buyers hopeful.
- 100-DMA, 200-DMA challenges Yen pair buyers amid overbought RSI (14).
The pair currently trades last at 136.368.
The previous day high was 136.92 while the previous day low was 135.73. The daily 38.2% Fib levels comes at 136.19, expected to provide support. Similarly, the daily 61.8% fib level is at 136.47, expected to provide resistance.
USD/JPY prints mild gains around 136.30-40 during early Wednesday morning in Europe. In doing so, the Yen pair snaps the previous two-day losing streak around the lowest levels since late December 2022. The recovery moves, however, gain little acceptance amid overbought RSI (14), as well as due to the presence of the key 100-DMA and 200-DMA.
Hence, the quote’s latest rebound needs validation from the 100-DMA and 200-DMA, respectively near 136.85 and 137.20, to convince buyers. Adding to the upside filter is the last December’s peak near 138.20.
Following that, the 140.00 round figure and late November 2022 high of 142.25 could lure the USD/JPY buyers.
On the flip side, a 13-day-long ascending support line, close to 135.35 at the latest, restricts the short-term pullback of the USD/JPY pair.
In a case where the USD/JPY price drops below the 135.35 support, the January 2022 peak near 134.75 can act as the additional check for the pair bears before aiming for the multiple support levels surrounding 131.00.
Overall, USD/JPY may trace bullish MACD signals to extend the run-up beyond the nearby support line but the room towards the north appears limited due to the existence of the key moving averages and overbought RSI conditions.
Trend: Limited upside expected
Technical Levels: Supports and Resistances
USDJPY currently trading at 136.37 at the time of writing. Pair opened at 136.14 and is trading with a change of 0.17% % .
| Overview | Overview.1 | |
|---|---|---|
| 0 | Today last price | 136.37 |
| 1 | Today Daily Change | 0.23 |
| 2 | Today Daily Change % | 0.17% |
| 3 | Today daily open | 136.14 |
The pair is trading above its 20 Daily moving average @ 133.1, above its 50 Daily moving average @ 131.86 , below its 100 Daily moving average @ 136.97 and below its 200 Daily moving average @ 137.18
| Trends | Trends.1 | |
|---|---|---|
| 0 | Daily SMA20 | 133.10 |
| 1 | Daily SMA50 | 131.86 |
| 2 | Daily SMA100 | 136.97 |
| 3 | Daily SMA200 | 137.18 |
The previous day high was 136.92 while the previous day low was 135.73. The daily 38.2% Fib levels comes at 136.19, expected to provide support. Similarly, the daily 61.8% fib level is at 136.47, expected to provide resistance.
Note the levels of interest below:
- Pivot support is noted at 135.61, 135.08, 134.42
- Pivot resistance is noted at 136.79, 137.45, 137.98
| Levels | Levels.1 |
|---|---|
| Previous Daily High | 136.92 |
| Previous Daily Low | 135.73 |
| Previous Weekly High | 136.52 |
| Previous Weekly Low | 133.92 |
| Previous Monthly High | 136.92 |
| Previous Monthly Low | 128.08 |
| Daily Fibonacci 38.2% | 136.19 |
| Daily Fibonacci 61.8% | 136.47 |
| Daily Pivot Point S1 | 135.61 |
| Daily Pivot Point S2 | 135.08 |
| Daily Pivot Point S3 | 134.42 |
| Daily Pivot Point R1 | 136.79 |
| Daily Pivot Point R2 | 137.45 |
| Daily Pivot Point R3 | 137.98 |
[/s2If]
Join Our Telegram Group


