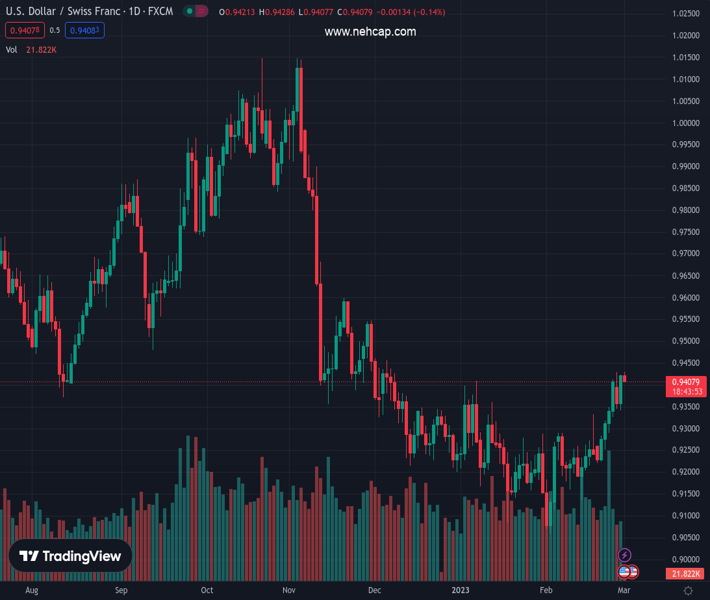
#USDCHF @ 0.94080 takes offers to renew intraday high even as risk-aversion prevails. (Pivot Orderbook analysis)
…
This is a premium post.
[s2If !current_user_can(access_s2member_level4)]Please register for PREMIUM VERSION HERE to read full post below containing analysis. In case of any error or you think you are not able to read the full post below, please email us at support#nehcap.com [lwa][/s2If] [s2If current_user_can(access_s2member_level4)]
- USD/CHF takes offers to renew intraday high even as risk-aversion prevails.
- US Dollar struggles to track upbeat yields amid strong China data, softer statistics at home.
- Downbeat Swiss GDP, hawkish Fed bets favored buyers the previous day.
The pair currently trades last at 0.94080.
The previous day high was 0.942 while the previous day low was 0.9342. The daily 38.2% Fib levels comes at 0.939, expected to provide support. Similarly, the daily 61.8% fib level is at 0.9371, expected to provide support.
USD/CHF renews its intraday low around 0.9410 as bulls take a breather following the strong February performance during early Wednesday. In doing so, the Swiss currency pair fails to justify the market’s mildly offbeat tone amid fears of higher rates and inflation. The reason could be linked to China as recent activity data from the world’s largest industrial player came in impressive for February.
That said, China’s Caixin Manufacturing PMI traces official activity data per NBS Manufacturing and Non-Manufacturing PMI to mark a strong economic rebound in February. Even so, China Finance Minister Liu He said after the data release that the foundation of China’s economic recovery is still not stable.
It should be noted that the month-start consolidation and the recently softer US data also seem to favor the USD/CHF bears. On Tuesday, the US Conference Board’s (CB) Consumer Confidence dropped for the second consecutive month to 102.9 versus 106.0 prior (revised) while US Housing Price Index drops 0.1% in December versus -0.6% market forecasts and -0.1% prior. On the same line, the S&P/Case-Shiller Home Price Indices grew 4.6% YoY during the said month compared to 6.1% market expectations and 6.8% previous readings. Furthermore, Chicago Purchasing Managers’ Index for February eased to 43.6 from 44.3 previous readings and 45.0 market consensus whereas the Richmond Fed Manufacturing Index for the said month eased below 11.0 prior and -5.0 expected to -16.
Even so, the market’s fears of higher inflation and interest rates keep the USD/CHF buyers hopeful. While portraying the mood, the S&P 500 Futures track Wall Street’s mild losses around 3,960. Further, the US 10-year Treasury bond yields rose two basis points (bps) to 3.93% while the two-year counterpart rises four bps to 4.84% by the press time. With this, both the key bond coupons march towards the three-month high marked in February after printing the biggest monthly gain since September 2022.
Apart from the risk-off mood, downbeat data at home also could keep the USD/CHF buyers hopeful. Swiss Gross Domestic Product (GDP) arrived at 0% in the fourth quarter (Q4) of 2022 vs. a growth of 0.3% and 0.2% recorded in the third quarter.
Moving forward, Swiss Real Retail Sales for January can direct immediate USD/CHF moves ahead of US activity data for the said month. However, major attention will be given to the next week’s monthly jobs report, Federal Reserve (Fed) Chairman Jerome Powell’s testimony and the Federal Open Market Committee (FOMC) monetary policy meeting for clear directions.
USD/CHF pullback remains elusive unless the quote drops back below the 100-day Exponential Moving Average (EMA) level surrounding 0.9385.
Technical Levels: Supports and Resistances
USDCHF currently trading at 0.9411 at the time of writing. Pair opened at 0.9418 and is trading with a change of -0.07% % .
| Overview | Overview.1 | |
|---|---|---|
| 0 | Today last price | 0.9411 |
| 1 | Today Daily Change | -0.0007 |
| 2 | Today Daily Change % | -0.07% |
| 3 | Today daily open | 0.9418 |
The pair is trading above its 20 Daily moving average @ 0.9257, above its 50 Daily moving average @ 0.9255 , below its 100 Daily moving average @ 0.9453 and below its 200 Daily moving average @ 0.957
| Trends | Trends.1 | |
|---|---|---|
| 0 | Daily SMA20 | 0.9257 |
| 1 | Daily SMA50 | 0.9255 |
| 2 | Daily SMA100 | 0.9453 |
| 3 | Daily SMA200 | 0.9570 |
The previous day high was 0.942 while the previous day low was 0.9342. The daily 38.2% Fib levels comes at 0.939, expected to provide support. Similarly, the daily 61.8% fib level is at 0.9371, expected to provide support.
Note the levels of interest below:
- Pivot support is noted at 0.9366, 0.9315, 0.9288
- Pivot resistance is noted at 0.9445, 0.9471, 0.9523
| Levels | Levels.1 |
|---|---|
| Previous Daily High | 0.9420 |
| Previous Daily Low | 0.9342 |
| Previous Weekly High | 0.9409 |
| Previous Weekly Low | 0.9221 |
| Previous Monthly High | 0.9429 |
| Previous Monthly Low | 0.9059 |
| Daily Fibonacci 38.2% | 0.9390 |
| Daily Fibonacci 61.8% | 0.9371 |
| Daily Pivot Point S1 | 0.9366 |
| Daily Pivot Point S2 | 0.9315 |
| Daily Pivot Point S3 | 0.9288 |
| Daily Pivot Point R1 | 0.9445 |
| Daily Pivot Point R2 | 0.9471 |
| Daily Pivot Point R3 | 0.9523 |
[/s2If]
Join Our Telegram Group


