#EURUSD @ 1.05833 prints mild gains to lick its wounds after the biggest monthly loss since the September., @nehcap view: Further downside expected (Pivot Orderbook analysis)
…
This is a premium post.
[s2If !current_user_can(access_s2member_level4)]Please register for PREMIUM VERSION HERE to read full post below containing analysis. In case of any error or you think you are not able to read the full post below, please email us at support#nehcap.com [lwa][/s2If] [s2If current_user_can(access_s2member_level4)]
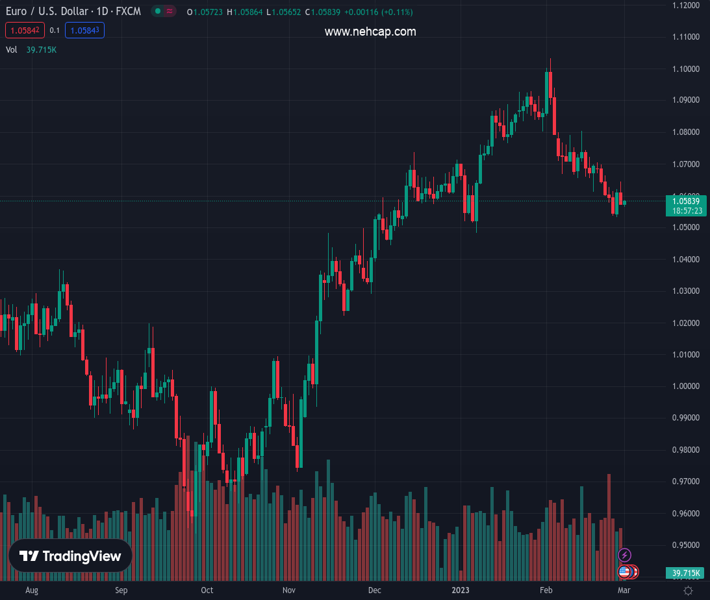
- EUR/USD prints mild gains to lick its wounds after the biggest monthly loss since the September.
- Repeated failures to cross 50-EMA, receding bullish bias of MACD keep sellers hopeful.
- Ascending support line from early January lures Euro sellers.
The pair currently trades last at 1.05833.
The previous day high was 1.0646 while the previous day low was 1.0577. The daily 38.2% Fib levels comes at 1.0603, expected to provide resistance. Similarly, the daily 61.8% fib level is at 1.0619, expected to provide resistance.
EUR/USD picks up bids to refresh intraday high around 1.0580-85 as it prints mild gains to consolidate the biggest monthly slump fall in five during early Wednesday.
In doing so, the Euro pair seems to brace for the first readings of Germany’s key inflation number for February, namely the Harmonized Index of Consumer Prices (HICP), expected 0.7% MoM versus 0.5% prior.
That said, the quote’s multiple failures to cross the 50-bar Exponential Moving Average (EMA) join the receding bullish bias of the MACD signals to favor sellers.
Even if the EUR/USD price crosses the 50-EMA hurdle surrounding 1.0620, a downward-sloping resistance line from mid-February and 200-EMA, close to 1.0640 and 1.0695 in that order, could challenge the pair buyers.
It’s worth observing that multiple levels marked since January 09 highlight the 1.0765-70 horizontal area as the last defense of the EUR/USD bears.
Meanwhile, a two-month-old ascending support line, near 1.0545, could restrict the short-term downside of the EUR/USD pair.
Following that, lows marked during the last month and January, around 1.0530 and 1.0480 in that order, could lure the EUR/USD bears.
Adding to the downside filters are the lows marked during late December 2022 around 1.0450.
Trend: Further downside expected
Technical Levels: Supports and Resistances
EURUSD currently trading at 1.0584 at the time of writing. Pair opened at 1.0577 and is trading with a change of 0.07% % .
| Overview | Overview.1 | |
|---|---|---|
| 0 | Today last price | 1.0584 |
| 1 | Today Daily Change | 0.0007 |
| 2 | Today Daily Change % | 0.07% |
| 3 | Today daily open | 1.0577 |
The pair is trading below its 20 Daily moving average @ 1.0703, below its 50 Daily moving average @ 1.0725 , above its 100 Daily moving average @ 1.0469 and above its 200 Daily moving average @ 1.033
| Trends | Trends.1 | |
|---|---|---|
| 0 | Daily SMA20 | 1.0703 |
| 1 | Daily SMA50 | 1.0725 |
| 2 | Daily SMA100 | 1.0469 |
| 3 | Daily SMA200 | 1.0330 |
The previous day high was 1.0646 while the previous day low was 1.0577. The daily 38.2% Fib levels comes at 1.0603, expected to provide resistance. Similarly, the daily 61.8% fib level is at 1.0619, expected to provide resistance.
Note the levels of interest below:
- Pivot support is noted at 1.0554, 1.0531, 1.0485
- Pivot resistance is noted at 1.0623, 1.0668, 1.0691
| Levels | Levels.1 |
|---|---|
| Previous Daily High | 1.0646 |
| Previous Daily Low | 1.0577 |
| Previous Weekly High | 1.0705 |
| Previous Weekly Low | 1.0536 |
| Previous Monthly High | 1.1033 |
| Previous Monthly Low | 1.0533 |
| Daily Fibonacci 38.2% | 1.0603 |
| Daily Fibonacci 61.8% | 1.0619 |
| Daily Pivot Point S1 | 1.0554 |
| Daily Pivot Point S2 | 1.0531 |
| Daily Pivot Point S3 | 1.0485 |
| Daily Pivot Point R1 | 1.0623 |
| Daily Pivot Point R2 | 1.0668 |
| Daily Pivot Point R3 | 1.0691 |
[/s2If]
Join Our Telegram Group


