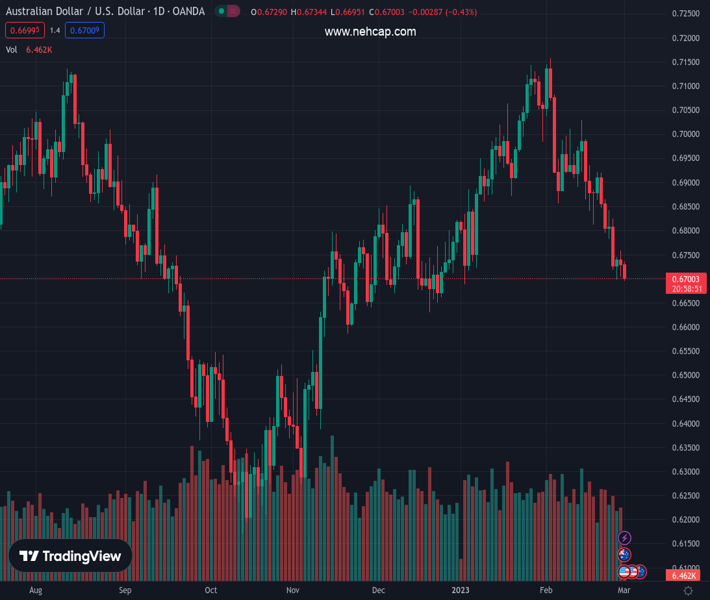
#AUDUSD @ 0.67005 has dropped sharply to near 0.6700 as a sheer decline in Australian monthly CPI and subdued GDP has trimmed hawkish RBA bets. (Pivot Orderbook analysis)
…
This is a premium post.
[s2If !current_user_can(access_s2member_level4)]Please register for PREMIUM VERSION HERE to read full post below containing analysis. In case of any error or you think you are not able to read the full post below, please email us at support#nehcap.com [lwa][/s2If] [s2If current_user_can(access_s2member_level4)]
- AUD/USD has dropped sharply to near 0.6700 as a sheer decline in Australian monthly CPI and subdued GDP has trimmed hawkish RBA bets.
- Australian monthly CPI
- has dropped significantly to 7.4% from the expectations of 8.0% and the prior release of 8.4%.
- The Australian GDP (Q4) has landed at 0.5% vs. the 0.6% released in Q3.
The pair currently trades last at 0.67005.
The previous day high was 0.6758 while the previous day low was 0.6704. The daily 38.2% Fib levels comes at 0.6724, expected to provide resistance. Similarly, the daily 61.8% fib level is at 0.6737, expected to provide resistance.
The AUD/USD pair has slipped sharply to near 0.6700 as the Australian Bureau of Statistics has reported mixed Gross Domestic Product (GDP) (Q4) data. The GDP data has landed at 0.5% in Q4, lower than the consensus of 0.8% and Q3 figure of 0.6%. On an annualized basis, the GDP has remained in line with expectations at 2.7%.
The monthly Consumer Price Index (CPI) (Jan) has dropped significantly to 7.4% from the expectations of 8.0% and the prior release of 8.4%. A mammoth decline in the inflation data is going to provide a big relief to Reserve Bank of Australia (RBA) policymakers.
RBA Governor Philip Lowe might continue its policy-tightening spell as the road to price stability is far from over.
A recent survey from Bloomberg claims that the Australian economy will fall into a recession while the United States economy is expected to dodge the recession situation. It is extremely difficult to predict a terminal rate for a central bank whose economy has not shown any evidence of inflation softening yet. Therefore, the chances of an Australian recession are extremely higher as the roadmap for achieving price stability in the Australian economy is full of struggles.
Going forward, the release of the Caixin Manufacturing PMI data will keep the Australian Dollar volatile. According to the consensus, IHS Markit will report an improvement in the Caixin Manufacturing PMI at 50.2, higher than the prior release of 49.2. The Chinese economy is on the path of a quick recovery after the rollback of lockdown curbs, therefore, a decent performance is anticipated by the market participants.
It is worth noting that Australia is the leading trading partner of China and upbeat PMI figures will strengthen the Australian Dollar ahead.
Meanwhile, the risk aversion theme is getting strengthened further amid bearish cues from the S&P500 futures. The 500-US stocks basket futures have ramped up their losses in the Asian session after a weak Tuesday as fears of more rates by the Federal Reserve (Fed) are deepening worries of a slowdown ahead. The US Dollar Index (DXY) has sensed a minor loss in the upside momentum near 104.60, however, the upside bias has not been ruled out yet.
Technical Levels: Supports and Resistances
AUDUSD currently trading at 0.6718 at the time of writing. Pair opened at 0.6726 and is trading with a change of -0.12 % .
| Overview | Overview.1 | |
|---|---|---|
| 0 | Today last price | 0.6718 |
| 1 | Today Daily Change | -0.0008 |
| 2 | Today Daily Change % | -0.1200 |
| 3 | Today daily open | 0.6726 |
The pair remains strongly bearish on the daily time frame. It trades below the 20 SMA @ 0.6898, 50 SMA 0.6895, 100 SMA @ 0.6735 and 200 SMA @ 0.6797.
| Trends | Trends.1 | |
|---|---|---|
| 0 | Daily SMA20 | 0.6898 |
| 1 | Daily SMA50 | 0.6895 |
| 2 | Daily SMA100 | 0.6735 |
| 3 | Daily SMA200 | 0.6797 |
The previous day high was 0.6758 while the previous day low was 0.6704. The daily 38.2% Fib levels comes at 0.6724, expected to provide resistance. Similarly, the daily 61.8% fib level is at 0.6737, expected to provide resistance.
Note the levels of interest below:
- Pivot support is noted at 0.6701, 0.6676, 0.6647
- Pivot resistance is noted at 0.6754, 0.6783, 0.6808
| Levels | Levels.1 |
|---|---|
| Previous Daily High | 0.6758 |
| Previous Daily Low | 0.6704 |
| Previous Weekly High | 0.6921 |
| Previous Weekly Low | 0.6719 |
| Previous Monthly High | 0.7158 |
| Previous Monthly Low | 0.6698 |
| Daily Fibonacci 38.2% | 0.6724 |
| Daily Fibonacci 61.8% | 0.6737 |
| Daily Pivot Point S1 | 0.6701 |
| Daily Pivot Point S2 | 0.6676 |
| Daily Pivot Point S3 | 0.6647 |
| Daily Pivot Point R1 | 0.6754 |
| Daily Pivot Point R2 | 0.6783 |
| Daily Pivot Point R3 | 0.6808 |
[/s2If]
Join Our Telegram Group


