#NZDUSD @ 0.61831 struggles inside one-month-old bullish chart formation after easing from weekly top., @nehcap view: Further upside expected (Pivot Orderbook analysis)
…
This is a premium post.
[s2If !current_user_can(access_s2member_level4)]Please register for PREMIUM VERSION HERE to read full post below containing analysis. In case of any error or you think you are not able to read the full post below, please email us at support#nehcap.com [lwa][/s2If] [s2If current_user_can(access_s2member_level4)]
- NZD/USD struggles inside one-month-old bullish chart formation after easing from weekly top.
- Bullish MACD signals add strength to the upside bias.
- Sellers need validation from mid-November 2022 low for further dominance.
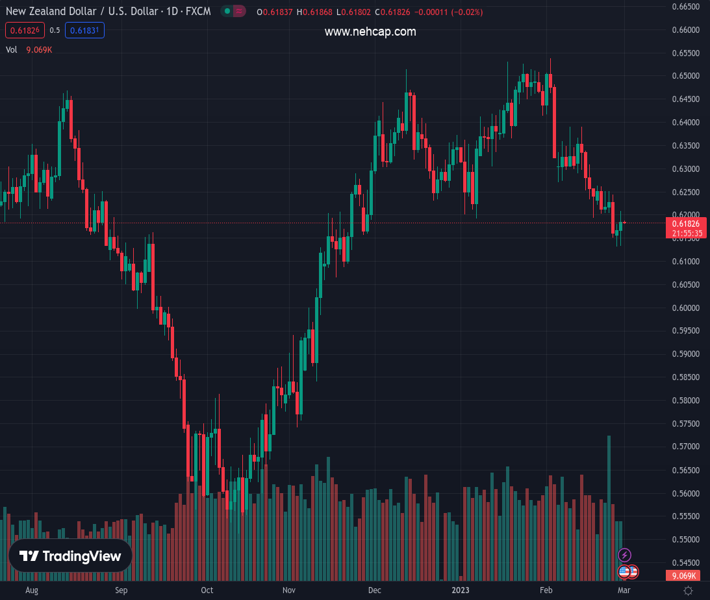
The pair currently trades last at 0.61831.
The previous day high was 0.6181 while the previous day low was 0.6131. The daily 38.2% Fib levels comes at 0.6162, expected to provide support. Similarly, the daily 61.8% fib level is at 0.615, expected to provide support.
NZD/USD picks up bids to reverse the previous day’s pullback from an important resistance surrounding 0.6200 during early Wednesday. In doing so, the Kiwi pair appears softer within the one-month-long falling wedge bullish chart formation.
In addition to the latest pick-up, the bullish MACD signals also add strength to the recovery hopes.
However, a two-week-old descending resistance line, close to the 0.6200 round figure, restricts the immediate upside of the quote.
Following that, a convergence of the 50-bar Simple Moving Average (SMA) and the stated falling wedge’s top line seems a tough nut to crack for the NZD/USD buyers around 0.6210.
In a case where the Kiwi pair remains firmer past 0.6210, the mid-February high near 0.6390 and the previous monthly top surrounding 0.6540 could act as intermediate halts during the theoretical run-up targeting the 0.6600 threshold.
On the flip side, pullback moves may witness multiple hurdles near 0.6170 and 0.6130 before poking the stated wedge’s lower line, close to 0.6120 by the press time.
Even if the NZD/USD bears defy the bullish chart pattern by breaking the 0.6120 support, lows marked during mid-November 2022, around 0.6060 could challenge the pair’s further downside.
Trend: Further upside expected
Technical Levels: Supports and Resistances
NZDUSD currently trading at 0.6186 at the time of writing. Pair opened at 0.6168 and is trading with a change of 0.29% % .
| Overview | Overview.1 | |
|---|---|---|
| 0 | Today last price | 0.6186 |
| 1 | Today Daily Change | 0.0018 |
| 2 | Today Daily Change % | 0.29% |
| 3 | Today daily open | 0.6168 |
The pair is trading below its 20 Daily moving average @ 0.6303, below its 50 Daily moving average @ 0.6344 , below its 100 Daily moving average @ 0.6192 and above its 200 Daily moving average @ 0.6183
| Trends | Trends.1 | |
|---|---|---|
| 0 | Daily SMA20 | 0.6303 |
| 1 | Daily SMA50 | 0.6344 |
| 2 | Daily SMA100 | 0.6192 |
| 3 | Daily SMA200 | 0.6183 |
The previous day high was 0.6181 while the previous day low was 0.6131. The daily 38.2% Fib levels comes at 0.6162, expected to provide support. Similarly, the daily 61.8% fib level is at 0.615, expected to provide support.
Note the levels of interest below:
- Pivot support is noted at 0.6139, 0.611, 0.6089
- Pivot resistance is noted at 0.6189, 0.621, 0.6239
| Levels | Levels.1 |
|---|---|
| Previous Daily High | 0.6181 |
| Previous Daily Low | 0.6131 |
| Previous Weekly High | 0.6263 |
| Previous Weekly Low | 0.6151 |
| Previous Monthly High | 0.6531 |
| Previous Monthly Low | 0.6190 |
| Daily Fibonacci 38.2% | 0.6162 |
| Daily Fibonacci 61.8% | 0.6150 |
| Daily Pivot Point S1 | 0.6139 |
| Daily Pivot Point S2 | 0.6110 |
| Daily Pivot Point S3 | 0.6089 |
| Daily Pivot Point R1 | 0.6189 |
| Daily Pivot Point R2 | 0.6210 |
| Daily Pivot Point R3 | 0.6239 |
[/s2If]
Join Our Telegram Group


