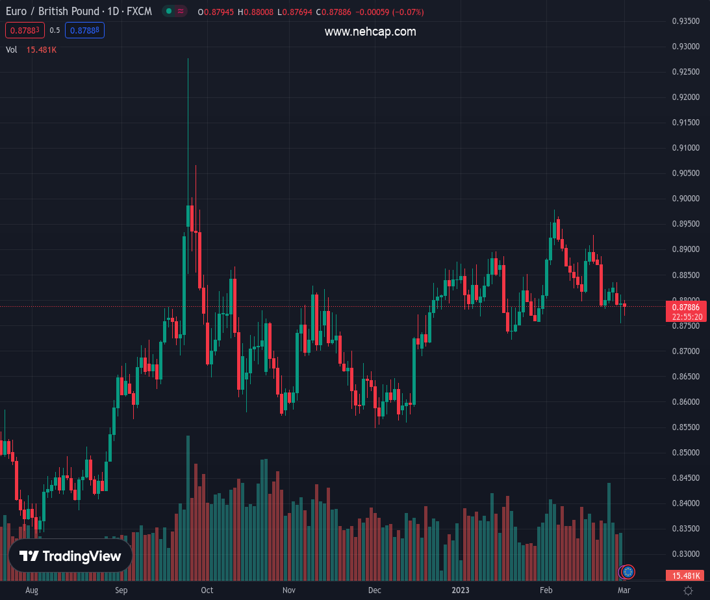
#EURGBP @ 0.87901 recovered some ground and finished Tuesday’s sessions with gains but shy of 0.8800., @nehcap view: Downward biased. (Pivot Orderbook analysis)
…
This is a premium post.
[s2If !current_user_can(access_s2member_level4)]Please register for PREMIUM VERSION HERE to read full post below containing analysis. In case of any error or you think you are not able to read the full post below, please email us at support#nehcap.com [lwa][/s2If] [s2If current_user_can(access_s2member_level4)]
- EUR/GBP recovered some ground and finished Tuesday’s sessions with gains but shy of 0.8800.
- Long-term, the EUR/GBP fall below the 20/50-day EMA would exert downward pressure on the pair.
- On an intraday time frame, the EUR/GBP is headed for a bearish continuation, with sellers targeting 0.8730s.
The pair currently trades last at 0.87901.
The previous day high was 0.8836 while the previous day low was 0.879. The daily 38.2% Fib levels comes at 0.8807, expected to provide resistance. Similarly, the daily 61.8% fib level is at 0.8818, expected to provide resistance.
The EUR/GBP jumped after hitting a daily low at 0.8754 after piercing the 100-day Exponential Moving Average (EMA), which rests at 0.8759. Nevertheless, it finished Tuesday’s session with minuscule gains of 0.02%. At the time of writing, the EUR/GBP is trading at 0.8792.
After falling below the 20 and 50-day Exponential Moving Averages (EMAs) in the last week, the Euro (EUR) recovered some ground. Nevertheless, it clashed with the 20-day EMA at around the 0.8330s area and tumbled on news that the Eurozone (EU) and the United Kingdom (UK) reached an agreement on Northern Ireland. That exacerbated a fall below the 0.8800 figure, but EU’s inflation figures on Tuesday bolstered the EUR, which is staging a comeback.
Therefore, the EUR/GBP jumped and is hoovering underneath the 50-day EMA at 0.8808, waiting for a fresh catalyst.
Intraday speaking, the EUR/GBP 4-hour chart suggests the pair is downward biased, with all the EMAs sitting above the exchange rate and backed by the Relative Strength Index (RSI) in bearish territory, and it’s aiming down. In addition, the Rate of Change (RoC) it’s almost neutral.
As long as the EUR/GBP remains below the February 27 daily high of 0.8835, the path of least resistance is bearish. Hence, the EUR/GBP’s first support would be the daily pivot point at 0.8790, which, once breached, the pair’s next stop would be the S1 pivot at 0.8763. If sellers stepped in, that would open the door to test January’s 19 daily low of 0.8721, slightly below the S2 daily pivot point at 0.8730.
An alternative scenario would be that the EUR/GBP reclaims 0.8811, opening the door for further upside.
Trend: Downward biased.
Technical Levels: Supports and Resistances
EURGBP currently trading at 0.8794 at the time of writing. Pair opened at 0.8798 and is trading with a change of -0.05 % .
| Overview | Overview.1 | |
|---|---|---|
| 0 | Today last price | 0.8794 |
| 1 | Today Daily Change | -0.0004 |
| 2 | Today Daily Change % | -0.0500 |
| 3 | Today daily open | 0.8798 |
The pair is trading below its 20 Daily moving average @ 0.8862, below its 50 Daily moving average @ 0.883 , above its 100 Daily moving average @ 0.8752 and above its 200 Daily moving average @ 0.8662
| Trends | Trends.1 | |
|---|---|---|
| 0 | Daily SMA20 | 0.8862 |
| 1 | Daily SMA50 | 0.8830 |
| 2 | Daily SMA100 | 0.8752 |
| 3 | Daily SMA200 | 0.8662 |
The previous day high was 0.8836 while the previous day low was 0.879. The daily 38.2% Fib levels comes at 0.8807, expected to provide resistance. Similarly, the daily 61.8% fib level is at 0.8818, expected to provide resistance.
Note the levels of interest below:
- Pivot support is noted at 0.878, 0.8762, 0.8734
- Pivot resistance is noted at 0.8826, 0.8854, 0.8872
| Levels | Levels.1 |
|---|---|
| Previous Daily High | 0.8836 |
| Previous Daily Low | 0.8790 |
| Previous Weekly High | 0.8892 |
| Previous Weekly Low | 0.8784 |
| Previous Monthly High | 0.8897 |
| Previous Monthly Low | 0.8722 |
| Daily Fibonacci 38.2% | 0.8807 |
| Daily Fibonacci 61.8% | 0.8818 |
| Daily Pivot Point S1 | 0.8780 |
| Daily Pivot Point S2 | 0.8762 |
| Daily Pivot Point S3 | 0.8734 |
| Daily Pivot Point R1 | 0.8826 |
| Daily Pivot Point R2 | 0.8854 |
| Daily Pivot Point R3 | 0.8872 |
[/s2If]
Join Our Telegram Group


