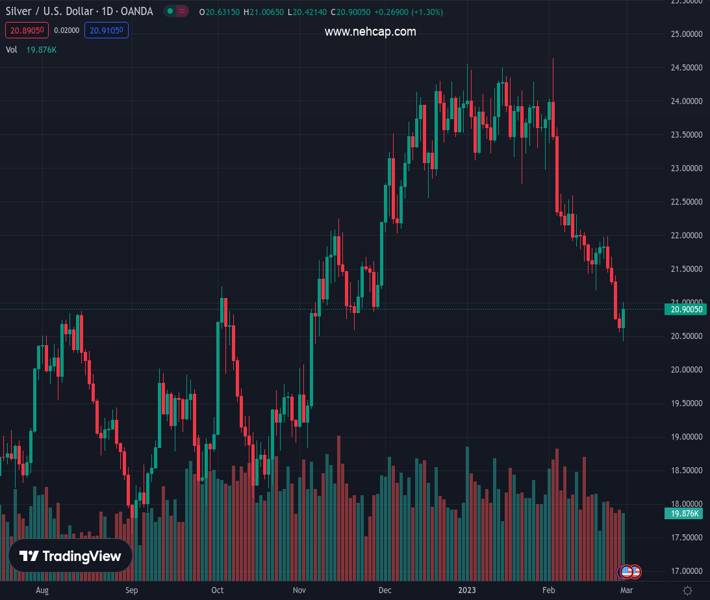
#XAGUSD @ 20.890 Silver continues its recovery despite broad US Dollar strength and high UST yields. (Pivot Orderbook analysis)
…
This is a premium post.
[s2If !current_user_can(access_s2member_level4)]Please register for PREMIUM VERSION HERE to read full post below containing analysis. In case of any error or you think you are not able to read the full post below, please email us at support#nehcap.com [lwa][/s2If] [s2If current_user_can(access_s2member_level4)]
- Silver continues its recovery despite broad US Dollar strength and high UST yields.
- A bullish engulfing candle pattern in the XAG/USD daily chart emerged, warranting upside pressure.
- XAG/USD Price Analysis: In the medium term, the white metal is downward biased.
The pair currently trades last at 20.890.
The previous day high was 20.84 while the previous day low was 20.56. The daily 38.2% Fib levels comes at 20.67, expected to provide support. Similarly, the daily 61.8% fib level is at 20.74, expected to provide support.
Silver price is staging a comeback after falling to fresh YTD lows at $20.43 a troy ounce and climbs toward the $20.80 area as Wall Street closes. The white metal is posting gains of 1.30% and is trading at $20.89 at the time of typing.
Silver’s rally was capped by fundamental reasons like a strong US Dollar (USD), up 0.32% per the US Dollar Index, and rising UST yields. Despite all that, Silver hit a daily high at $21.00 before retracing some of its gains.
Technically speaking, XAG/USD is forming a bullish engulfing candle pattern, which would exacerbate a rally above $21.00, though it remains far from changing Silver’s bias.
The Relative Strength Index (RSI) exited from oversold conditions at 30, sponsored Tuesday’s gains, while the Rate of Change (RoC) portrays that previous selling pressure is waning.
The XAG/USD needs to crack the psychological $21.00 barrier for a bullish continuation. Once done, that would pave the way toward the 20 and 200-day Exponential Moving Averages (EMAs) at $21.82 and $21.89 a troy ounce, respectively, ahead of testing the 100-day EMA at $22.09.
On the flip side, the XAG/USD next support would be $20.43, which, once cleared, would keep sellers in charge, exposing the white metal to new YTD lows. The next floor would be the psychological $20.00, ahead of testing the November 3 daily low of $18.84.
Technical Levels: Supports and Resistances
XAGUSD currently trading at 20.9 at the time of writing. Pair opened at 20.59 and is trading with a change of 1.51 % .
| Overview | Overview.1 | |
|---|---|---|
| 0 | Today last price | 20.90 |
| 1 | Today Daily Change | 0.31 |
| 2 | Today Daily Change % | 1.51 |
| 3 | Today daily open | 20.59 |
The pair remains strongly bearish on the daily time frame. It trades below the 20 SMA @ 22.05, 50 SMA 23.09, 100 SMA @ 22.03 and 200 SMA @ 21.0.
| Trends | Trends.1 | |
|---|---|---|
| 0 | Daily SMA20 | 22.05 |
| 1 | Daily SMA50 | 23.09 |
| 2 | Daily SMA100 | 22.03 |
| 3 | Daily SMA200 | 21.00 |
The previous day high was 20.84 while the previous day low was 20.56. The daily 38.2% Fib levels comes at 20.67, expected to provide support. Similarly, the daily 61.8% fib level is at 20.74, expected to provide support.
Note the levels of interest below:
- Pivot support is noted at 20.48, 20.38, 20.2
- Pivot resistance is noted at 20.77, 20.95, 21.05
| Levels | Levels.1 |
|---|---|
| Previous Daily High | 20.84 |
| Previous Daily Low | 20.56 |
| Previous Weekly High | 21.98 |
| Previous Weekly Low | 20.74 |
| Previous Monthly High | 24.55 |
| Previous Monthly Low | 22.76 |
| Daily Fibonacci 38.2% | 20.67 |
| Daily Fibonacci 61.8% | 20.74 |
| Daily Pivot Point S1 | 20.48 |
| Daily Pivot Point S2 | 20.38 |
| Daily Pivot Point S3 | 20.20 |
| Daily Pivot Point R1 | 20.77 |
| Daily Pivot Point R2 | 20.95 |
| Daily Pivot Point R3 | 21.05 |
[/s2If]
Join Our Telegram Group


