WTI erases Monday’s losses and jumps from around $75.60s on China’s reopening expectations. (Pivot Orderbook analysis)
…
This is a premium post.
[s2If !current_user_can(access_s2member_level4)]Please register for PREMIUM VERSION HERE to read full post below containing analysis. In case of any error or you think you are not able to read the full post below, please email us at support#nehcap.com [lwa][/s2If] [s2If current_user_can(access_s2member_level4)]
- WTI erases Monday’s losses and jumps from around $75.60s on China’s reopening expectations.
- US inventories fell, a headwind for WTI price.
- WTI Price Analysis: To continue sideways unless bulls reclaim $78.00 bpd.
The pair currently trades last at 77.15.
The previous day high was 76.85 while the previous day low was 75.05. The daily 38.2% Fib levels comes at 75.74, expected to provide support. Similarly, the daily 61.8% fib level is at 76.16, expected to provide support.
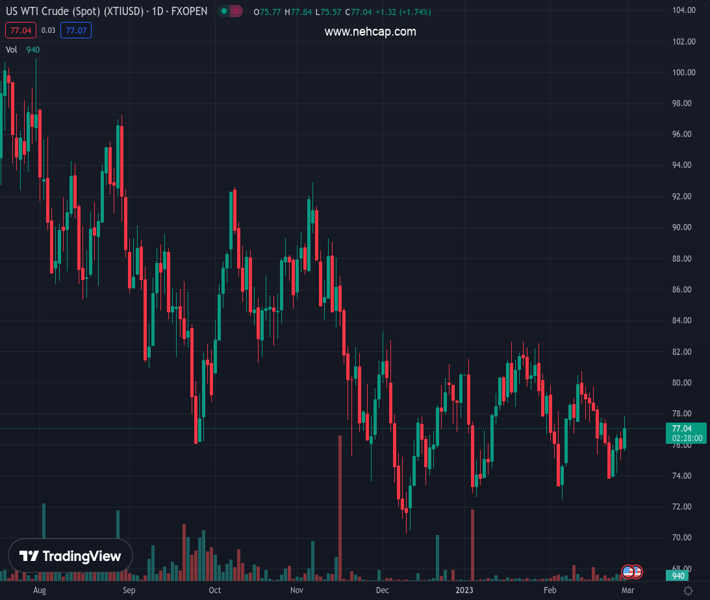
Western Texas Intermediate (WTI), the US crude oil benchmark, advance 1.90% on Tuesday courtesy of renewed expectations for oil demand due to China, despite growing speculations that the US Federal Reserve (Fed) would continue to tighten monetary conditions. Therefore, WTI is trading at $77.11, above its opening price, after hitting a low of $75.60.
Sentiment remains upbeat as Wall Street registers gains, except for the Dow Jones. The greenback has recently recovered some ground, capping WTI’s gains during the day, as the US Dollar Index edges up 0.14%.
WTI has reversed Monday’s losses spurred by expectations of increasing oil demand due to China’s reopening. That offset speculations that the Fed would raise rates at least to the 5.25%-5.50% threshold, as money market futures had shown. Furthermore, the US Energy Information and Administration (EIA) office said that production in the US fell to 12.10 million bpd, its lowest since April 2022.
In the meantime, Russia’s oil exports to China grew due to rising demand and lower freight costs.
Nevertheless, WTI’s rally was capped by the Organization of the Petroleum Exporting Countries (OPEC) announcement, which reported that OPEC+ countries pumped 28.97 million barrels per day (bpd) in February, up 150K from January. However, production remains 700K bpd below from September 2022.
According to a Reuters poll, oil prices are expected to rise above $90 a barrel toward the 2023 second half, as Chinese demand recovers and Russia’s output falls.
Technically speaking, WTI’s daily chart is neutral to downward biased. During Tuesday’s session, it was rejected at the 50-day Exponential Moving Average (EMA) around 77.99, though it’s clinging to gains above the 20-day EMA at 77.02. The Relative Strength Index (RSI) triggered a bullish signal as it crossed above the 50-midline, but buyers must reclaim the 50-day EMA for a bullish continuation that could send WTI rallying toward the YTD high at $82.44. On the flip side, a fall below the 20-day EMA will spur a drop to the February 22 daily low of $73.83.
Technical Levels: Supports and Resistances
XTIUSD currently trading at 77.15 at the time of writing. Pair opened at 75.72 and is trading with a change of 1.89 % .
| Overview | Overview.1 | |
|---|---|---|
| 0 | Today last price | 77.15 |
| 1 | Today Daily Change | 1.43 |
| 2 | Today Daily Change % | 1.89 |
| 3 | Today daily open | 75.72 |
The pair is trading above its 20 Daily moving average @ 77.11, below its 50 Daily moving average @ 78.02 , below its 100 Daily moving average @ 80.11 and below its 200 Daily moving average @ 88.43
| Trends | Trends.1 | |
|---|---|---|
| 0 | Daily SMA20 | 77.11 |
| 1 | Daily SMA50 | 78.02 |
| 2 | Daily SMA100 | 80.11 |
| 3 | Daily SMA200 | 88.43 |
The previous day high was 76.85 while the previous day low was 75.05. The daily 38.2% Fib levels comes at 75.74, expected to provide support. Similarly, the daily 61.8% fib level is at 76.16, expected to provide support.
Note the levels of interest below:
- Pivot support is noted at 74.9, 74.07, 73.09
- Pivot resistance is noted at 76.7, 77.68, 78.51
| Levels | Levels.1 |
|---|---|
| Previous Daily High | 76.85 |
| Previous Daily Low | 75.05 |
| Previous Weekly High | 77.75 |
| Previous Weekly Low | 73.86 |
| Previous Monthly High | 82.68 |
| Previous Monthly Low | 72.64 |
| Daily Fibonacci 38.2% | 75.74 |
| Daily Fibonacci 61.8% | 76.16 |
| Daily Pivot Point S1 | 74.90 |
| Daily Pivot Point S2 | 74.07 |
| Daily Pivot Point S3 | 73.09 |
| Daily Pivot Point R1 | 76.70 |
| Daily Pivot Point R2 | 77.68 |
| Daily Pivot Point R3 | 78.51 |
[/s2If]
Join Our Telegram Group


