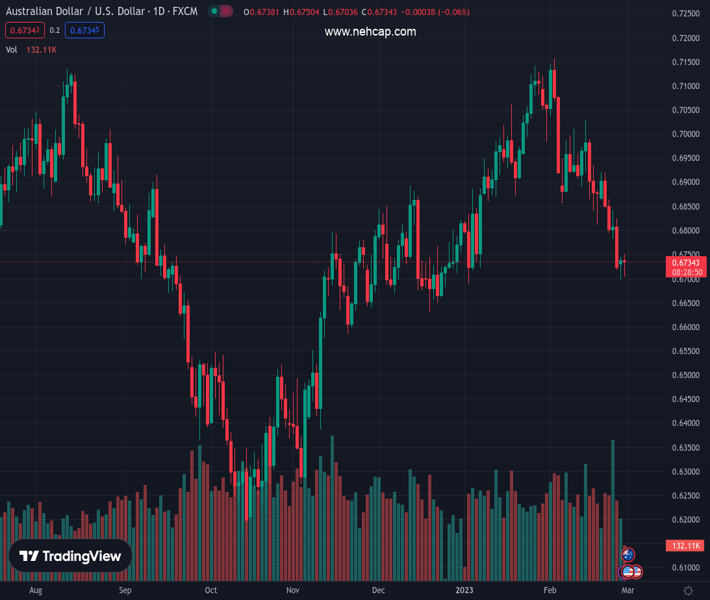
#AUDUSD @ 0.67353 is seen consolidating its recent fall to the lowest level since January. (Pivot Orderbook analysis)
…
This is a premium post.
[s2If !current_user_can(access_s2member_level4)]Please register for PREMIUM VERSION HERE to read full post below containing analysis. In case of any error or you think you are not able to read the full post below, please email us at support#nehcap.com [lwa][/s2If] [s2If current_user_can(access_s2member_level4)]
- AUD/USD is seen consolidating its recent fall to the lowest level since January.
- A positive risk tone undermines the USD and benefits the risk-sensitive Aussie.
- The setup still favours bearish traders and supports prospects for further losses.
The pair currently trades last at 0.67353.
The previous day high was 0.6745 while the previous day low was 0.6698. The daily 38.2% Fib levels comes at 0.6727, expected to provide support. Similarly, the daily 61.8% fib level is at 0.6716, expected to provide support.
The AUD/USD pair seesaws between tepid gains/minor losses, though manages to hold its neck above the 0.6700 mark heading into the North American session on Tuesday. The setup, meanwhile, remains tilted in favour of bearish traders and supports prospects for a further near-term depreciating move.
A modest recovery in the risk sentiment undermines the safe-haven US Dollar and turns out to be a key factor lending some support to the risk-sensitive Aussie. That said, rising bets for more interest rate hikes by the Fed remain supportive of elevated US Treasury bond yields and act as a tailwind for the Greenback. This, along with looming recession risks and geopolitical tensions, suggests that the path of least resistance for the AUD/USD pair is to the downside.
From a technical perspective, Friday’s breakdown through confluence support near the 0.6800-0.6780 region was seen as a fresh trigger for bearish traders. The said area comprises the 200-day SMA and the 38.2% Fibonacci retracement level of the rally from the October 2022 low. Moreover, oscillators on the daily chart are holding deep in the negative territory and are still far from being in the oversold zone, validating the bearish outlook for the AUD/USD pair.
That said, bearish traders are likely to wait for sustained weakness below the 0.6700 round figure before placing fresh bets. The AUD/USD pair might then accelerate the fall to the 0.6660 zone, or the 50% Fibo. level, en route to the 0.6600 mark. The downward trajectory could get extended further towards the 61.8% Fibo. level, around the 0.6550 region. The latter should act as a strong base for spot prices and help limit further losses, for the time being.
On the flip side, any meaningful recovery attempt beyond the 0.6750 level, or the daily top, could meet with a fresh supply near the 0.6780-0.6800 confluence support breakpoint, now turned resistance. A sustained strength beyond, however, might trigger a short-covering rally and lift the AUD/USD pair to the next relevant hurdle near the 0.6875-0.6880 region. This is followed by the 0.6900 mark and the 23.6% Fibo. level, around the 0.6925 area, which should cap gains.
Technical Levels: Supports and Resistances
AUDUSD currently trading at 0.6738 at the time of writing. Pair opened at 0.6739 and is trading with a change of -0.01 % .
| Overview | Overview.1 | |
|---|---|---|
| 0 | Today last price | 0.6738 |
| 1 | Today Daily Change | -0.0001 |
| 2 | Today Daily Change % | -0.0100 |
| 3 | Today daily open | 0.6739 |
The pair is trading below its 20 Daily moving average @ 0.6914, below its 50 Daily moving average @ 0.6894 , above its 100 Daily moving average @ 0.673 and below its 200 Daily moving average @ 0.6799
| Trends | Trends.1 | |
|---|---|---|
| 0 | Daily SMA20 | 0.6914 |
| 1 | Daily SMA50 | 0.6894 |
| 2 | Daily SMA100 | 0.6730 |
| 3 | Daily SMA200 | 0.6799 |
The previous day high was 0.6745 while the previous day low was 0.6698. The daily 38.2% Fib levels comes at 0.6727, expected to provide support. Similarly, the daily 61.8% fib level is at 0.6716, expected to provide support.
Note the levels of interest below:
- Pivot support is noted at 0.671, 0.6681, 0.6663
- Pivot resistance is noted at 0.6757, 0.6774, 0.6803
| Levels | Levels.1 |
|---|---|
| Previous Daily High | 0.6745 |
| Previous Daily Low | 0.6698 |
| Previous Weekly High | 0.6921 |
| Previous Weekly Low | 0.6719 |
| Previous Monthly High | 0.7143 |
| Previous Monthly Low | 0.6688 |
| Daily Fibonacci 38.2% | 0.6727 |
| Daily Fibonacci 61.8% | 0.6716 |
| Daily Pivot Point S1 | 0.6710 |
| Daily Pivot Point S2 | 0.6681 |
| Daily Pivot Point S3 | 0.6663 |
| Daily Pivot Point R1 | 0.6757 |
| Daily Pivot Point R2 | 0.6774 |
| Daily Pivot Point R3 | 0.6803 |
[/s2If]
Join Our Telegram Group


