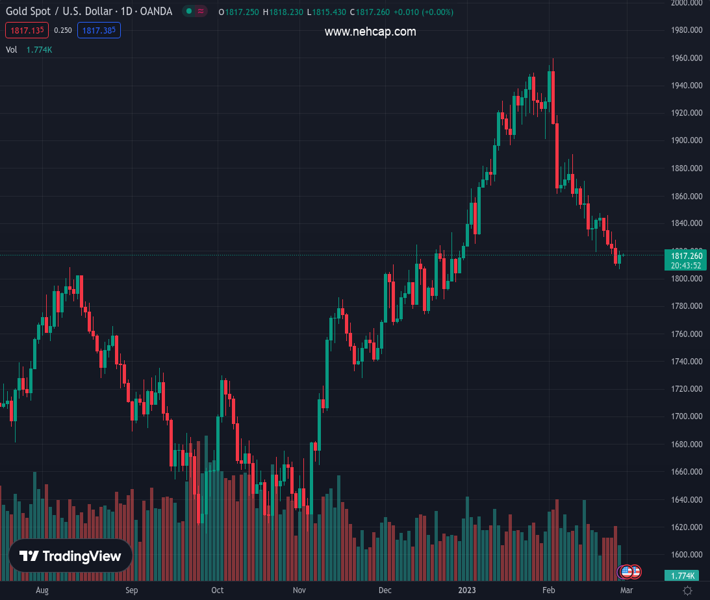
#XAUUSD @ 1,816.95 Gold price is oscillating in a narrow range below $1,820.00 as investors await US Manufacturing PMI. (Pivot Orderbook analysis)
…
This is a premium post.
[s2If !current_user_can(access_s2member_level4)]Please register for PREMIUM VERSION HERE to read full post below containing analysis. In case of any error or you think you are not able to read the full post below, please email us at support#nehcap.com [lwa][/s2If] [s2If current_user_can(access_s2member_level4)]
- Gold price is oscillating in a narrow range below $1,820.00 as investors await US Manufacturing PMI.
- S&P500 futures have added more gains to Monday’s recovery, indicating an improvement in investors’ risk appetite.
- The resilience observed in US consumer spending has forced the street to ramp up its terminal rate projections.
The pair currently trades last at 1816.95.
The previous day high was 1820.21 while the previous day low was 1806.66. The daily 38.2% Fib levels comes at 1815.03, expected to provide support. Similarly, the daily 61.8% fib level is at 1811.84, expected to provide support.
Gold price (XAU/USD) is demonstrating a sideways auction below $1,820.00 in the Asian session. The precious metal is expected to come out of the woods as investors are shifting their focus towards the United States ISM Manufacturing PMI (Feb), which is scheduled for Wednesday.
Investors should note that US Manufacturing PMI is contracting consecutively for the past three months. As per the consensus, the economic data is expected to contract again, however, the scale of contraction will be lower. The US Manufacturing PMI is seen at 48.0, lower than the former release of 47.4.
S&P500 futures have added more gains to Monday’s recovery in the Asian session, portraying an improvement in the risk appetite of the market participants. The US Dollar Index (DXY) is expected to demonstrate a volatility contraction till the release of the US ISM Manufacturing PMI data. The 10-year US Treasury yields are juggling around 3.92%.
Meanwhile, resilience observed in consumer spending (Feb) in the United States has forced the street to ramp up their terminal rate projections. A note from Bank of America (BofA) suggests Fed chair Jerome Powell announcing three more rate hikes this year considering the resilience in the demand-driven inflation. The BofA sees the terminal rate above 6% and recession appears more likely than a soft landing.
Gold price is auctioning in a Falling Channel chart pattern in which every pullback is considered as a selling opportunity before a reversal move. The precious metal has sensed resistance around $1,820.00 after a minor pullback move.
The 20-period Exponential Moving Average (EMA) at $1,815.83 is providing a cushion to the Gold bulls.
The Relative Strength Index (RSI) (14) is attempting to shift into the bullish range of 60.00-80.00.
Technical Levels: Supports and Resistances
XAUUSD currently trading at 1816.54 at the time of writing. Pair opened at 1817.32 and is trading with a change of -0.04 % .
| Overview | Overview.1 | |
|---|---|---|
| 0 | Today last price | 1816.54 |
| 1 | Today Daily Change | -0.78 |
| 2 | Today Daily Change % | -0.04 |
| 3 | Today daily open | 1817.32 |
The pair is trading below its 20 Daily moving average @ 1858.92, below its 50 Daily moving average @ 1865.96 , above its 100 Daily moving average @ 1793.84 and above its 200 Daily moving average @ 1775.83
| Trends | Trends.1 | |
|---|---|---|
| 0 | Daily SMA20 | 1858.92 |
| 1 | Daily SMA50 | 1865.96 |
| 2 | Daily SMA100 | 1793.84 |
| 3 | Daily SMA200 | 1775.83 |
The previous day high was 1820.21 while the previous day low was 1806.66. The daily 38.2% Fib levels comes at 1815.03, expected to provide support. Similarly, the daily 61.8% fib level is at 1811.84, expected to provide support.
Note the levels of interest below:
- Pivot support is noted at 1809.25, 1801.18, 1795.7
- Pivot resistance is noted at 1822.8, 1828.28, 1836.35
| Levels | Levels.1 |
|---|---|
| Previous Daily High | 1820.21 |
| Previous Daily Low | 1806.66 |
| Previous Weekly High | 1847.59 |
| Previous Weekly Low | 1808.99 |
| Previous Monthly High | 1949.27 |
| Previous Monthly Low | 1823.76 |
| Daily Fibonacci 38.2% | 1815.03 |
| Daily Fibonacci 61.8% | 1811.84 |
| Daily Pivot Point S1 | 1809.25 |
| Daily Pivot Point S2 | 1801.18 |
| Daily Pivot Point S3 | 1795.70 |
| Daily Pivot Point R1 | 1822.80 |
| Daily Pivot Point R2 | 1828.28 |
| Daily Pivot Point R3 | 1836.35 |
[/s2If]
Join Our Telegram Group
")


