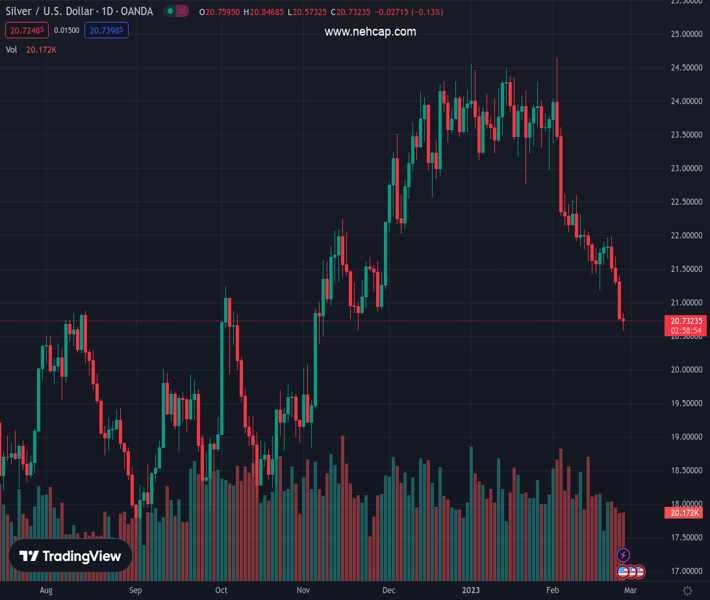
#XAGUSD @ 20.732 Silver price prolongs its losses to four consecutive days after slumping below the 200-DMA. (Pivot Orderbook analysis)
…
This is a premium post.
[s2If !current_user_can(access_s2member_level4)]Please register for PREMIUM VERSION HERE to read full post below containing analysis. In case of any error or you think you are not able to read the full post below, please email us at support#nehcap.com [lwa][/s2If] [s2If current_user_can(access_s2member_level4)]
- Silver price prolongs its losses to four consecutive days after slumping below the 200-DMA.
- Silver Price Analysis: A bearish continuation is likely, even though RSI is oversold; caution is warranted.
The pair currently trades last at 20.732.
The previous day high was 21.4 while the previous day low was 20.74. The daily 38.2% Fib levels comes at 20.99, expected to provide resistance. Similarly, the daily 61.8% fib level is at 21.15, expected to provide resistance.
Silver price dropped to a fresh YTD low of $20.58 a troy ounce but has trimmed some of its losses. Even though the US Dollar (USD) remains soft and the US bond yields are down, the white metal is losing 0.14%. At the time of writing, the XAG/USD exchanges hands at $20.72.
From a daily chart perspective, the XAG/USD is downward biased. Furthermore, the 20-day Exponential Moving Average (EMA) is about to cross below the 200-day EMA, triggering a death cross and exacerbating a fall toward the next demand area, the November 3 daily low of $18.84. A breach of the latter would open the door for further downside, exposing crucial support zones. The critical support areas exposed would be October’s 14 low of $18.09, followed by September’s 28 at 17.97, ahead of last year’s low at $17.56.
Even though the path of least resistance is downwards, the Relative Strength Index (RSI) at oversold conditions could trigger consolidation before the bearish continuation.
As an alternate scenario, the XAG/USD first resistance would be the psychological $21.00 figure. Once reclaimed, bulls could drive prices towards the February 24 high at $21.39, followed by February 23 daily high at 21.67. Next, the 20/200-day EMAs intersection would be tested, around $21.90s.
Technical Levels: Supports and Resistances
XAGUSD currently trading at 20.67 at the time of writing. Pair opened at 20.76 and is trading with a change of -0.43 % .
| Overview | Overview.1 | |
|---|---|---|
| 0 | Today last price | 20.67 |
| 1 | Today Daily Change | -0.09 |
| 2 | Today Daily Change % | -0.43 |
| 3 | Today daily open | 20.76 |
The pair remains strongly bearish on the daily time frame. It trades below the 20 SMA @ 22.2, 50 SMA 23.14, 100 SMA @ 22.02 and 200 SMA @ 21.01.
| Trends | Trends.1 | |
|---|---|---|
| 0 | Daily SMA20 | 22.20 |
| 1 | Daily SMA50 | 23.14 |
| 2 | Daily SMA100 | 22.02 |
| 3 | Daily SMA200 | 21.01 |
The previous day high was 21.4 while the previous day low was 20.74. The daily 38.2% Fib levels comes at 20.99, expected to provide resistance. Similarly, the daily 61.8% fib level is at 21.15, expected to provide resistance.
Note the levels of interest below:
- Pivot support is noted at 20.53, 20.31, 19.87
- Pivot resistance is noted at 21.2, 21.63, 21.86
| Levels | Levels.1 |
|---|---|
| Previous Daily High | 21.40 |
| Previous Daily Low | 20.74 |
| Previous Weekly High | 21.98 |
| Previous Weekly Low | 20.74 |
| Previous Monthly High | 24.55 |
| Previous Monthly Low | 22.76 |
| Daily Fibonacci 38.2% | 20.99 |
| Daily Fibonacci 61.8% | 21.15 |
| Daily Pivot Point S1 | 20.53 |
| Daily Pivot Point S2 | 20.31 |
| Daily Pivot Point S3 | 19.87 |
| Daily Pivot Point R1 | 21.20 |
| Daily Pivot Point R2 | 21.63 |
| Daily Pivot Point R3 | 21.86 |
[/s2If]
Join Our Telegram Group
")


