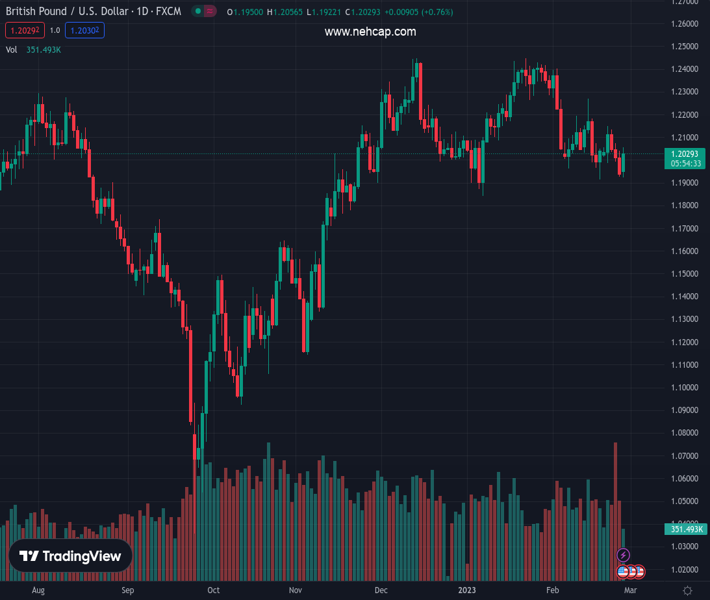
#GBPUSD @ 1.20308 got bolstered by a soft US Dollar and a risk-on impulse. (Pivot Orderbook analysis)
…
This is a premium post.
[s2If !current_user_can(access_s2member_level4)]Please register for PREMIUM VERSION HERE to read full post below containing analysis. In case of any error or you think you are not able to read the full post below, please email us at support#nehcap.com [lwa][/s2If] [s2If current_user_can(access_s2member_level4)]
- GBP/USD got bolstered by a soft US Dollar and a risk-on impulse.
- Durable Good Orders collapsed, with US companies feeling the pain of tighter monetary policy.
- The EU and the UK had agreed to a deal in Northern Ireland, which could boost the GBP.
The pair currently trades last at 1.20308.
The previous day high was 1.2042 while the previous day low was 1.1928. The daily 38.2% Fib levels comes at 1.1972, expected to provide support. Similarly, the daily 61.8% fib level is at 1.1999, expected to provide support.
GBP/USD is recovering some ground after hitting a daily low of 1.1921 as speculations for the Brexit deal struck in Northern Ireland grow, which could bolster the Pound Sterling (GBP) in the near term. In addition, worse-than-expected US economic data are a headwind for the greenback. At the time of typing, the GBP/USD is trading at 1.2052, above its opening price by 0.65%.
The US Dollar (USD) is weakening across the board on a dismal Durable Goods Orders report. Durable Good Orders for January plunged below expectations, -4.5%, below the last month’s revised 5.1% figures, the lowest reading since April 2020. The so-called core orders excluding transport rose by 0.7%, above December’s -.0.4% drop.
The US Dollar Index (DXY), a measure of the buck’s value against a basket of rivals, edged down 0.62%, at 104.594, retracing last Friday’s gains sponsored by a jump in the preferred’s gauge for inflation by the US Federal Reserve (FED), the Core PCE. Following goods orders data, the DXY dropped from around 105.100 toward current quotes.
In the meantime, the latest headlines that the United Kingdom (UK) and the Eurozone (EU) agreed to a deal in Northern Ireland sponsored a leg-up in the GBP/USD, as witnessed by the 1-Hour chart. After seesawing around the daily pivot at 1.1970, the GBP/USD jumped around 80 pips, though hit a daily high of 1.2054.
Sources on both sides told the BBC that the UK and EU had reached a post-Brexit trade agreement for Northern Ireland. Later, the EU’s President Ursula von der Leyen and the UK Prime Minister Rishi Sunak are expected to host a press conference at around 15:30 GMT. Details on the agreement will be released later.
From a daily chart perspective, the GBP/USD formed a bullish engulfing candle, which could send the pair rallying toward the 20-day EMA at 1.2088 before testing the 50-day EMA at 1.2097, shy of the 1.2100 mark. A breach of the latter would expose the important 200-day EMA at 12126. As an alternate scenario, the GBP/USD could fall toward the last week’s low at 1.1927 before testing 1.1900.
Technical Levels: Supports and Resistances
GBPUSD currently trading at 1.2054 at the time of writing. Pair opened at 1.1943 and is trading with a change of 0.93 % .
| Overview | Overview.1 | |
|---|---|---|
| 0 | Today last price | 1.2054 |
| 1 | Today Daily Change | 0.0111 |
| 2 | Today Daily Change % | 0.9300 |
| 3 | Today daily open | 1.1943 |
The pair is trading below its 20 Daily moving average @ 1.2109, below its 50 Daily moving average @ 1.2149 , above its 100 Daily moving average @ 1.1941 and above its 200 Daily moving average @ 1.193
| Trends | Trends.1 | |
|---|---|---|
| 0 | Daily SMA20 | 1.2109 |
| 1 | Daily SMA50 | 1.2149 |
| 2 | Daily SMA100 | 1.1941 |
| 3 | Daily SMA200 | 1.1930 |
The previous day high was 1.2042 while the previous day low was 1.1928. The daily 38.2% Fib levels comes at 1.1972, expected to provide support. Similarly, the daily 61.8% fib level is at 1.1999, expected to provide support.
Note the levels of interest below:
- Pivot support is noted at 1.19, 1.1858, 1.1787
- Pivot resistance is noted at 1.2014, 1.2085, 1.2127
| Levels | Levels.1 |
|---|---|
| Previous Daily High | 1.2042 |
| Previous Daily Low | 1.1928 |
| Previous Weekly High | 1.2148 |
| Previous Weekly Low | 1.1928 |
| Previous Monthly High | 1.2448 |
| Previous Monthly Low | 1.1841 |
| Daily Fibonacci 38.2% | 1.1972 |
| Daily Fibonacci 61.8% | 1.1999 |
| Daily Pivot Point S1 | 1.1900 |
| Daily Pivot Point S2 | 1.1858 |
| Daily Pivot Point S3 | 1.1787 |
| Daily Pivot Point R1 | 1.2014 |
| Daily Pivot Point R2 | 1.2085 |
| Daily Pivot Point R3 | 1.2127 |
[/s2If]
Join Our Telegram Group
")


