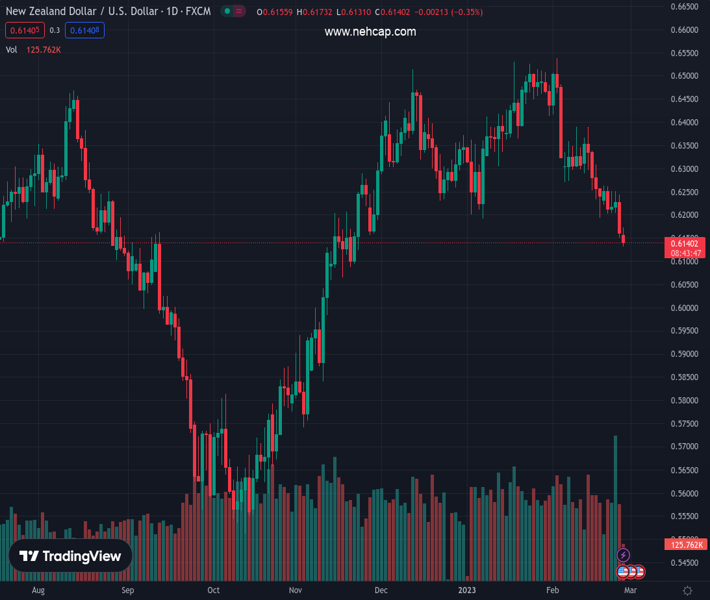
#NZDUSD @ 0.61411 continues losing ground on Monday and drops to its lowest level since November. (Pivot Orderbook analysis)
…
This is a premium post.
[s2If !current_user_can(access_s2member_level4)]Please register for PREMIUM VERSION HERE to read full post below containing analysis. In case of any error or you think you are not able to read the full post below, please email us at support#nehcap.com [lwa][/s2If] [s2If current_user_can(access_s2member_level4)]
- NZD/USD continues losing ground on Monday and drops to its lowest level since November.
- A modest recovery in the risk sentiment undermines the USD and lends support to the pair.
- Hawkish Fed expectations, elevated US bond yields support prospects for additional losses.
The pair currently trades last at 0.61411.
The previous day high was 0.6252 while the previous day low was 0.6151. The daily 38.2% Fib levels comes at 0.619, expected to provide resistance. Similarly, the daily 61.8% fib level is at 0.6214, expected to provide resistance.
The NZD/USD pair extends Friday’s breakdown momentum below the 200-day Simple Moving Average(SMA) and drops to over three-month low on the first day of a new week. The pair maintains its offered tone heading into the North American session and is currently placed just below mid-0.6100s, down nearly 0.50% for the day.
The US Dollar remains pinned near a seven-week high amid hawkish Fed expectations and turns out to be a key factor that continues to exert downward pressure on the NZD/USD pair. In fact, the markets seem convinced that the US central bank will stick to its hawkish stance in the wake of stubbornly high inflation. The bets were reaffirmed by the stronger US PCE Price Index data on Friday, which indicated that inflation isn’t coming down quite as fast as hoped.
Furthermore, the incoming robust US macro data points to an economy that remains resilient despite rising borrowing costs. This should allow the Fed to continue lifting interest rates, which remains supportive of elevated US Treasury bond yields and continues to lend support to the buck. That said, a modest recovery in the equity markets undermines the Greenback’s relative safe-haven status and helps limit losses for the risk-sensitive Kiwi, at least for now.
The fundamental backdrop, however, remains tilted in favour of bearish traders and suggests that the path of least resistance for the NZD/USD pair is to the downside. Moreover, Friday’s sustained break and close below a technically significant 200-day SMA adds credence to the negative outlook. Traders now look to the US economic docket, featuring the release of Durable Goods Orders and Pending Home Sales data, to grab short-term opportunities around the major.
Technical Levels: Supports and Resistances
NZDUSD currently trading at 0.6138 at the time of writing. Pair opened at 0.6165 and is trading with a change of -0.44 % .
| Overview | Overview.1 | |
|---|---|---|
| 0 | Today last price | 0.6138 |
| 1 | Today Daily Change | -0.0027 |
| 2 | Today Daily Change % | -0.4400 |
| 3 | Today daily open | 0.6165 |
The pair remains strongly bearish on the daily time frame. It trades below the 20 SMA @ 0.6318, 50 SMA 0.6348, 100 SMA @ 0.6186 and 200 SMA @ 0.6184.
| Trends | Trends.1 | |
|---|---|---|
| 0 | Daily SMA20 | 0.6318 |
| 1 | Daily SMA50 | 0.6348 |
| 2 | Daily SMA100 | 0.6186 |
| 3 | Daily SMA200 | 0.6184 |
The previous day high was 0.6252 while the previous day low was 0.6151. The daily 38.2% Fib levels comes at 0.619, expected to provide resistance. Similarly, the daily 61.8% fib level is at 0.6214, expected to provide resistance.
Note the levels of interest below:
- Pivot support is noted at 0.6127, 0.6089, 0.6026
- Pivot resistance is noted at 0.6227, 0.629, 0.6328
| Levels | Levels.1 |
|---|---|
| Previous Daily High | 0.6252 |
| Previous Daily Low | 0.6151 |
| Previous Weekly High | 0.6263 |
| Previous Weekly Low | 0.6151 |
| Previous Monthly High | 0.6531 |
| Previous Monthly Low | 0.6190 |
| Daily Fibonacci 38.2% | 0.6190 |
| Daily Fibonacci 61.8% | 0.6214 |
| Daily Pivot Point S1 | 0.6127 |
| Daily Pivot Point S2 | 0.6089 |
| Daily Pivot Point S3 | 0.6026 |
| Daily Pivot Point R1 | 0.6227 |
| Daily Pivot Point R2 | 0.6290 |
| Daily Pivot Point R3 | 0.6328 |
[/s2If]
Join Our Telegram Group
")


