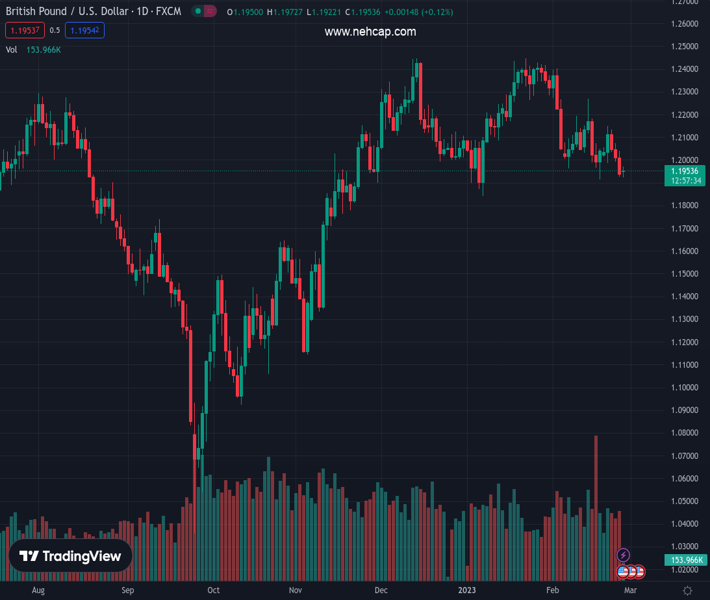
#GBPUSD @ 1.19535 continues to find some support and attracts some buyers near the 200-day SMA. (Pivot Orderbook analysis)
…
This is a premium post.
[s2If !current_user_can(access_s2member_level4)]Please register for PREMIUM VERSION HERE to read full post below containing analysis. In case of any error or you think you are not able to read the full post below, please email us at support#nehcap.com [lwa][/s2If] [s2If current_user_can(access_s2member_level4)]
- GBP/USD continues to find some support and attracts some buyers near the 200-day SMA.
- A modest USD pullback from a multi-week high is seen as a key factor acting as a tailwind.
- Hawkish Fed expectations should help limit the USD losses and cap the upside for the pair.
The pair currently trades last at 1.19535.
The previous day high was 1.2042 while the previous day low was 1.1928. The daily 38.2% Fib levels comes at 1.1972, expected to provide resistance. Similarly, the daily 61.8% fib level is at 1.1999, expected to provide resistance.
The GBP/USD pair defends a technically significant 200-day Simple Moving Average (SMA) on Monday and attracts some buyers in the vicinity of the monthly low. Spot prices stick to intraday gains, around the 1.1965-1.1975 region through the early part of the European session and for now, seem to have snapped a three-day losing streak.
A modest US Dollar pullback from a seven-week high turns out to be a key factor providing a lift to the GBP/USD pair. The USD downtick, meanwhile, could be attributed to some profit-taking amid a softer tone surrounding the US Treasury bond yields and a recovery in the US equity futures. Any meaningful slide for the Greenback, however, seems elusive, warranting some caution before positioning for a further appreciating move for the major.
The prospects for further policy tightening by the Fed should act as a tailwind for the US bond yields and lend support to the USD. In fact, the markets seem convinced that the US central bank will stick to its hawkish stance for longer in the wake of stubbornly high inflation. The bets were reaffirmed by the stronger US PCE Price Index data released on Friday, which indicated that inflation isn’t coming down quite as fast as hoped.
Moreover, the recent upbeat US macro data point to an economy that remains resilient despite rising borrowing costs and should allow the Fed to continue raising interest rates. Investors, meanwhile, remain worried about economic headwinds stemming from rapidly rising borrowing costs. This, along with geopolitical tensions, should limit losses for the safe-haven buck and keep a lid on the GBP/USD pair, at least for the time being.
In the absence of any relevant data from the UK, traders look to the US economic docket – featuring the release of Durable Goods Orders and Pending Home Sales data. This, along with the US bond yields and the broader risk sentiment, will influence the USD and provide some impetus to the GBP/USD pair. The aforementioned fundamental backdrop, meanwhile, suggests that the pair’s intraday move-up could be seen as a selling opportunity.
Technical Levels: Supports and Resistances
GBPUSD currently trading at 1.196 at the time of writing. Pair opened at 1.1943 and is trading with a change of 0.14 % .
| Overview | Overview.1 | |
|---|---|---|
| 0 | Today last price | 1.1960 |
| 1 | Today Daily Change | 0.0017 |
| 2 | Today Daily Change % | 0.1400 |
| 3 | Today daily open | 1.1943 |
The pair is trading below its 20 Daily moving average @ 1.2109, below its 50 Daily moving average @ 1.2149 , above its 100 Daily moving average @ 1.1941 and above its 200 Daily moving average @ 1.193
| Trends | Trends.1 | |
|---|---|---|
| 0 | Daily SMA20 | 1.2109 |
| 1 | Daily SMA50 | 1.2149 |
| 2 | Daily SMA100 | 1.1941 |
| 3 | Daily SMA200 | 1.1930 |
The previous day high was 1.2042 while the previous day low was 1.1928. The daily 38.2% Fib levels comes at 1.1972, expected to provide resistance. Similarly, the daily 61.8% fib level is at 1.1999, expected to provide resistance.
Note the levels of interest below:
- Pivot support is noted at 1.19, 1.1858, 1.1787
- Pivot resistance is noted at 1.2014, 1.2085, 1.2127
| Levels | Levels.1 |
|---|---|
| Previous Daily High | 1.2042 |
| Previous Daily Low | 1.1928 |
| Previous Weekly High | 1.2148 |
| Previous Weekly Low | 1.1928 |
| Previous Monthly High | 1.2448 |
| Previous Monthly Low | 1.1841 |
| Daily Fibonacci 38.2% | 1.1972 |
| Daily Fibonacci 61.8% | 1.1999 |
| Daily Pivot Point S1 | 1.1900 |
| Daily Pivot Point S2 | 1.1858 |
| Daily Pivot Point S3 | 1.1787 |
| Daily Pivot Point R1 | 1.2014 |
| Daily Pivot Point R2 | 1.2085 |
| Daily Pivot Point R3 | 1.2127 |
[/s2If]
Join Our Telegram Group
")


