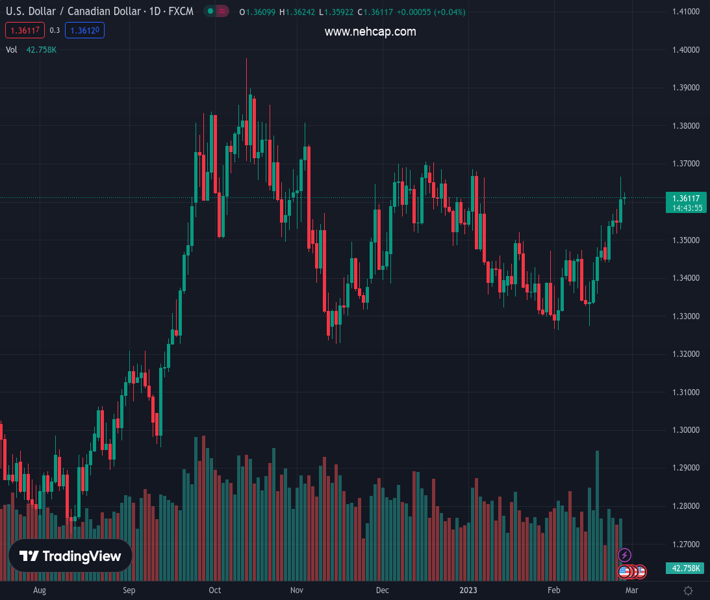
#USDCAD @ 1.36114 attracts some dip-buying on Monday and draws support from a combination of factors. (Pivot Orderbook analysis)
…
This is a premium post.
[s2If !current_user_can(access_s2member_level4)]Please register for PREMIUM VERSION HERE to read full post below containing analysis. In case of any error or you think you are not able to read the full post below, please email us at support#nehcap.com [lwa][/s2If] [s2If current_user_can(access_s2member_level4)]
- USD/CAD attracts some dip-buying on Monday and draws support from a combination of factors.
- Sliding Oil prices undermines the Loonie and acts as a tailwind for the pair amid a stronger USD.
- The fundamental backdrop favours bullish traders and supports prospects for a further move up.
The pair currently trades last at 1.36114.
The previous day high was 1.3666 while the previous day low was 1.3527. The daily 38.2% Fib levels comes at 1.3613, expected to provide resistance. Similarly, the daily 61.8% fib level is at 1.358, expected to provide support.
The USD/CAD pair attracts some buying following an intraday dip to sub-1.3600 levels on Monday and hits a fresh daily high during the early European session. The pair is currently placed around the 1.3625 region, though remains below its highest level since January 6 touched on Friday.
Crude Oil prices meet with a fresh supply on the first day of a new week, which is seen undermining the commodity-linked Loonie and lending support to the USD/CAD pair. Worries that rapidly rising borrowing costs will dampen economic growth and dent fuel demand overshadow the prospect of lower exports from Russia. This, in turn, fails to assist Oil prices to build on a two-day-old recovery move from a nearly three-week low touched last Thursday.
Apart from this, bets that the Bank of Canada (BoC) will pause the policy-tightening cycle, bolstered by softer Canadian consumer inflation figures released last week, weighs on the domestic currency. In contrast, the Federal Reserve is expected to stick to its hawkish stance in the wake of stubbornly high inflation. This, along with a softer risk tone, keeps the safe-haven US Dollar pinned near a multi-week high and acts as a tailwind for the USD/CAD pair.
The prospects for further policy tightening by the Fed were reaffirmed by the stronger US PCE data on Friday, which indicated that inflation isn’t coming down quite as fast as hoped. Adding to this, the incoming positive US macro data point to an economy that remains resilient despite rising borrowing costs and fueled hawkish Fed expectations. This remains supportive of elevated US Treasury bond yields and continues to boost the Greenback.
The aforementioned fundamental backdrop seems tilted firmly in favour of bulls and suggests that the path of least resistance for the USD/CAD pair is to the upside. Market participants now look to the US economic docket, featuring the release of Durable Goods Orders and Pending Home Sales data. This, along with Oil price dynamics, should provide a fresh impetus to the USD/CAD pair and allow traders to grab short-term opportunities.
Technical Levels: Supports and Resistances
USDCAD currently trading at 1.3619 at the time of writing. Pair opened at 1.3606 and is trading with a change of 0.1 % .
| Overview | Overview.1 | |
|---|---|---|
| 0 | Today last price | 1.3619 |
| 1 | Today Daily Change | 0.0013 |
| 2 | Today Daily Change % | 0.1000 |
| 3 | Today daily open | 1.3606 |
The pair remains strongly bullish on the daily timeframe. It trades above its 20 SMA @ 1.3424, 50 SMA 1.3462, 100 SMA @ 1.3512 and 200 SMA @ 1.3264.
| Trends | Trends.1 | |
|---|---|---|
| 0 | Daily SMA20 | 1.3424 |
| 1 | Daily SMA50 | 1.3462 |
| 2 | Daily SMA100 | 1.3512 |
| 3 | Daily SMA200 | 1.3264 |
The previous day high was 1.3666 while the previous day low was 1.3527. The daily 38.2% Fib levels comes at 1.3613, expected to provide resistance. Similarly, the daily 61.8% fib level is at 1.358, expected to provide support.
Note the levels of interest below:
- Pivot support is noted at 1.3534, 1.3462, 1.3396
- Pivot resistance is noted at 1.3672, 1.3738, 1.381
| Levels | Levels.1 |
|---|---|
| Previous Daily High | 1.3666 |
| Previous Daily Low | 1.3527 |
| Previous Weekly High | 1.3666 |
| Previous Weekly Low | 1.3441 |
| Previous Monthly High | 1.3685 |
| Previous Monthly Low | 1.3300 |
| Daily Fibonacci 38.2% | 1.3613 |
| Daily Fibonacci 61.8% | 1.3580 |
| Daily Pivot Point S1 | 1.3534 |
| Daily Pivot Point S2 | 1.3462 |
| Daily Pivot Point S3 | 1.3396 |
| Daily Pivot Point R1 | 1.3672 |
| Daily Pivot Point R2 | 1.3738 |
| Daily Pivot Point R3 | 1.3810 |
[/s2If]
Join Our Telegram Group
")


