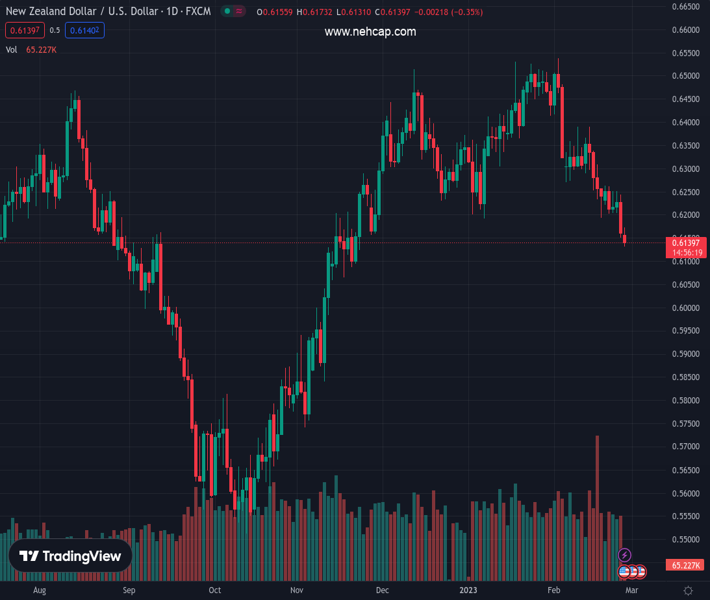
#NZDUSD @ 0.61392 drops to the lowest levels in three months, grinds near intraday low of late. (Pivot Orderbook analysis)
…
This is a premium post.
[s2If !current_user_can(access_s2member_level4)]Please register for PREMIUM VERSION HERE to read full post below containing analysis. In case of any error or you think you are not able to read the full post below, please email us at support#nehcap.com [lwa][/s2If] [s2If current_user_can(access_s2member_level4)]
- NZD/USD drops to the lowest levels in three months, grinds near intraday low of late.
- Downbeat NZ Retail Sales, comments from RBNZ’s Conway keep bears hopeful.
- US Dollar cheers strong inflation clues, hawkish Fed talks amid upbeat yields.
- US Durable Goods Orders, risk catalysts eyed for fresh impulse.
The pair currently trades last at 0.61392.
The previous day high was 0.6252 while the previous day low was 0.6151. The daily 38.2% Fib levels comes at 0.619, expected to provide resistance. Similarly, the daily 61.8% fib level is at 0.6214, expected to provide resistance.
NZD/USD bears keep the reins at the lowest levels since November 2022, down half a percent near 0.6130 during early Monday, as downbeat New Zealand (NZ) catalysts contrast with the US Dollar demand.
That said, NZ Retail Sales marked -0.6% QoQ figure for the fourth quarter (Q4) earlier in the day, versus 1.5% expected and 0.4% prior.
On the other hand, Reserve Bank of New Zealand (RBNZ) Chief Economist Paul Conway said, “As interest rates rise, I expect consumption to slow.”
Meanwhile, strong US inflation-linked data joined the Fed policymakers’ support for higher rates to propel the Fed fund futures to above 5.30%, versus 5.10% expected by the US central bank in December. The same joins the latest bout of sanctions on Russia from the West to escalate the market’s fears of more geopolitical tension, which in turn underpins the US Dollar’s haven demand.
US Dollar Index (DXY) renews its intraday high around 105.32 following the initial pullback from a seven-week high, while tracing upbeat US Treasury bond yields. It’s worth noting, US 10-year Treasury yields reverse the early-day losses to around 3.95%. Further, the two-year counterparts jump back towards the highest levels since November 2022, marked the previous day, as bond bears poke the 4.83% level by the press time. Further, the S&P 500 Futures lick its wounds with mild gains after the Wall Street benchmark posted the biggest weekly slump of 2023.
Moving ahead, the US Durable Goods Orders for January, expected -4.0% versus 5.6% prior, will be important to watch for clear directions ahead of Wednesday’s official activity data from China.
A daily closing below the 200-DMA, around 0.6170 by the press time, directs NZD/USD bears towards July 2022 low near 0.6060.
Technical Levels: Supports and Resistances
NZDUSD currently trading at 0.6132 at the time of writing. Pair opened at 0.6165 and is trading with a change of -0.54% % .
| Overview | Overview.1 | |
|---|---|---|
| 0 | Today last price | 0.6132 |
| 1 | Today Daily Change | -0.0033 |
| 2 | Today Daily Change % | -0.54% |
| 3 | Today daily open | 0.6165 |
The pair remains strongly bearish on the daily time frame. It trades below the 20 SMA @ 0.6318, 50 SMA 0.6348, 100 SMA @ 0.6186 and 200 SMA @ 0.6184.
| Trends | Trends.1 | |
|---|---|---|
| 0 | Daily SMA20 | 0.6318 |
| 1 | Daily SMA50 | 0.6348 |
| 2 | Daily SMA100 | 0.6186 |
| 3 | Daily SMA200 | 0.6184 |
The previous day high was 0.6252 while the previous day low was 0.6151. The daily 38.2% Fib levels comes at 0.619, expected to provide resistance. Similarly, the daily 61.8% fib level is at 0.6214, expected to provide resistance.
Note the levels of interest below:
- Pivot support is noted at 0.6127, 0.6089, 0.6026
- Pivot resistance is noted at 0.6227, 0.629, 0.6328
| Levels | Levels.1 |
|---|---|
| Previous Daily High | 0.6252 |
| Previous Daily Low | 0.6151 |
| Previous Weekly High | 0.6263 |
| Previous Weekly Low | 0.6151 |
| Previous Monthly High | 0.6531 |
| Previous Monthly Low | 0.6190 |
| Daily Fibonacci 38.2% | 0.6190 |
| Daily Fibonacci 61.8% | 0.6214 |
| Daily Pivot Point S1 | 0.6127 |
| Daily Pivot Point S2 | 0.6089 |
| Daily Pivot Point S3 | 0.6026 |
| Daily Pivot Point R1 | 0.6227 |
| Daily Pivot Point R2 | 0.6290 |
| Daily Pivot Point R3 | 0.6328 |
[/s2If]
Join Our Telegram Group
")


