#GBPJPY @ 162.700 takes offers to extend pullback from one-week-old horizontal resistance., @nehcap view: Further downside expected (Pivot Orderbook analysis)
…
This is a premium post.
[s2If !current_user_can(access_s2member_level4)]Please register for PREMIUM VERSION HERE to read full post below containing analysis. In case of any error or you think you are not able to read the full post below, please email us at support#nehcap.com [lwa][/s2If] [s2If current_user_can(access_s2member_level4)]
- GBP/JPY takes offers to extend pullback from one-week-old horizontal resistance.
- Looming bear cross on MACD, RSI retreat add strength to downside bias.
- 50-SMA restricts immediate downside, bulls need validation from monthly high.
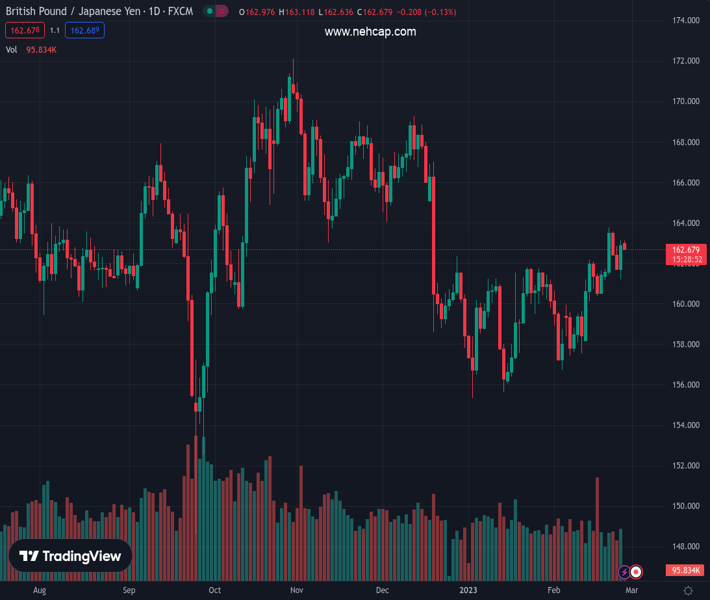
The pair currently trades last at 162.700.
The previous day high was 163.12 while the previous day low was 161.22. The daily 38.2% Fib levels comes at 162.4, expected to provide support. Similarly, the daily 61.8% fib level is at 161.95, expected to provide support.
GBP/JPY prints mild losses around 162.75-80 as it pares the previous day’s gains around the intraday low heading into Monday’s London open.
In doing so, the cross-currency pair justifies the early-day Doji candlestick formation, as well as the U-turn from a one-week-old horizontal resistance line.
Adding strength to the downside bias is the RSI (14) retreat from the +50.0 area, often considered an overbought zone, as well as the looming bear cross on the MACD.
That said, the GBP/JPY bears are well-set to visit the 50-SMA support near 162.00.
Following that, a two-week-old ascending support line precedes an upward-sloping trend line from February 03 to challenge the GBP/JPY bears around 161.45 and 161.20 in that order.
It should be noted that the pair’s weakness past 161.20 will have the 161.00 round figure as the last defense, a break of which could make it vulnerable to challenge the mid-month swing low surrounding 160.00.
On the contrary, recovery moves remain elusive below the immediate resistance line, around 163.25 by the press time. Following that, the monthly high of 163.76 may act as an extra filter towards the north.
If the GBP/JPY bulls keep the reins past 163.76, the early December 2022 low near 164.00 will be in the spotlight ahead of directing the quote towards the last September’s peak of 167.22.
Trend: Further downside expected
Technical Levels: Supports and Resistances
GBPJPY currently trading at 162.76 at the time of writing. Pair opened at 162.92 and is trading with a change of -0.10% % .
| Overview | Overview.1 | |
|---|---|---|
| 0 | Today last price | 162.76 |
| 1 | Today Daily Change | -0.16 |
| 2 | Today Daily Change % | -0.10% |
| 3 | Today daily open | 162.92 |
The pair is trading above its 20 Daily moving average @ 160.44, above its 50 Daily moving average @ 160.09 , below its 100 Daily moving average @ 163.57 and below its 200 Daily moving average @ 163.35
| Trends | Trends.1 | |
|---|---|---|
| 0 | Daily SMA20 | 160.44 |
| 1 | Daily SMA50 | 160.09 |
| 2 | Daily SMA100 | 163.57 |
| 3 | Daily SMA200 | 163.35 |
The previous day high was 163.12 while the previous day low was 161.22. The daily 38.2% Fib levels comes at 162.4, expected to provide support. Similarly, the daily 61.8% fib level is at 161.95, expected to provide support.
Note the levels of interest below:
- Pivot support is noted at 161.72, 160.52, 159.82
- Pivot resistance is noted at 163.62, 164.33, 165.53
| Levels | Levels.1 |
|---|---|
| Previous Daily High | 163.12 |
| Previous Daily Low | 161.22 |
| Previous Weekly High | 163.76 |
| Previous Weekly Low | 161.17 |
| Previous Monthly High | 161.85 |
| Previous Monthly Low | 155.36 |
| Daily Fibonacci 38.2% | 162.40 |
| Daily Fibonacci 61.8% | 161.95 |
| Daily Pivot Point S1 | 161.72 |
| Daily Pivot Point S2 | 160.52 |
| Daily Pivot Point S3 | 159.82 |
| Daily Pivot Point R1 | 163.62 |
| Daily Pivot Point R2 | 164.33 |
| Daily Pivot Point R3 | 165.53 |
[/s2If]
Join Our Telegram Group
")


