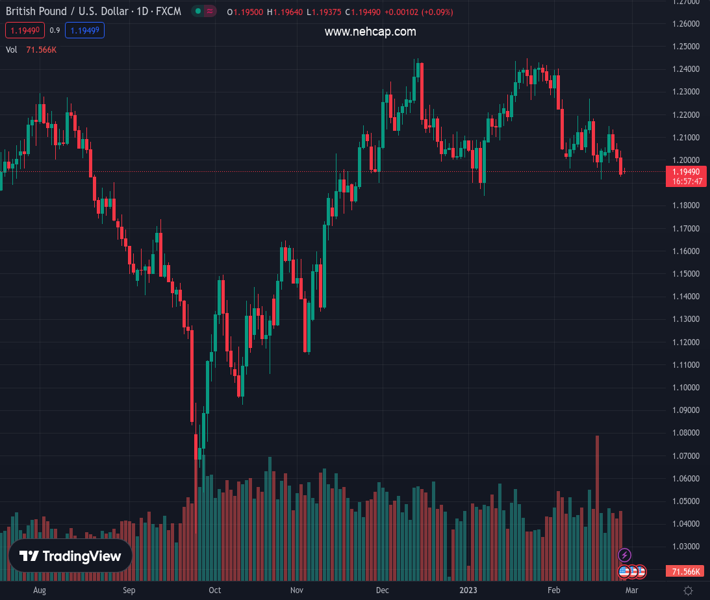
#GBPUSD @ 1.19487 fades bounce off a seven-week-old ascending support line., @nehcap view: Further downside expected (Pivot Orderbook analysis)
…
This is a premium post.
[s2If !current_user_can(access_s2member_level4)]Please register for PREMIUM VERSION HERE to read full post below containing analysis. In case of any error or you think you are not able to read the full post below, please email us at support#nehcap.com [lwa][/s2If] [s2If current_user_can(access_s2member_level4)]
- GBP/USD fades bounce off a seven-week-old ascending support line.
- Oversold RSI (14) challenges sellers but bearish MACD signals, sustained trading below 200-SMA keeps buyers off the table.
- UK PM Rishi Sunak, European Commission President Ursula von der Leyen’s Brexit deal news is key.
The pair currently trades last at 1.19487.
The previous day high was 1.2042 while the previous day low was 1.1928. The daily 38.2% Fib levels comes at 1.1972, expected to provide resistance. Similarly, the daily 61.8% fib level is at 1.1999, expected to provide resistance.
GBP/USD portrays the pre-event anxiety as it wobbles around mid-1.1900s ahead of the key Brexit announcements scheduled for release during early Monday.
Also read: GBP/USD struggles to justify Brexit hopes around 1.1950 amid hawkish Fed concerns
In doing so, the Cable pair fades the previous day’s bounce off an upward-sloping support line from early January amid the oversold RSI conditions. However, the quote’s sustained trading below the 200-SMA and the bearish MACD signals keep the GBP/USD bears hopeful of breaking the 1.1930 immediate support.
Following that, the monthly low of 1.1915 and the 1.1840 can act as extra filters towards the south before directing the GBP/USD price to September 2022 high near 1.1740.
It’s worth noting that tops marked in the last October, around 1.1645 and 1.1500, could lure the Cable bears past 1.1740.
On the flip side, a one-week-old descending resistance line, close to the 1.2000 psychological magnet, restricts immediate recovery moves of the GBP/USD pair.
Even if the quote rises past 1.2000, a downward-sloping resistance line from early February, near 1.2135 at the latest, should challenge the GBP/USD buyers.
Also important to note is that the Cable pair bulls remain off the table unless witnessing the pair’s sustained trading beyond the 200-SMA, close to 1.2190 by the press time.
Trend: Further downside expected
Technical Levels: Supports and Resistances
GBPUSD currently trading at 1.1945 at the time of writing. Pair opened at 1.1943 and is trading with a change of 0.02 % .
| Overview | Overview.1 | |
|---|---|---|
| 0 | Today last price | 1.1945 |
| 1 | Today Daily Change | 0.0002 |
| 2 | Today Daily Change % | 0.0200 |
| 3 | Today daily open | 1.1943 |
The pair is trading below its 20 Daily moving average @ 1.2109, below its 50 Daily moving average @ 1.2149 , above its 100 Daily moving average @ 1.1941 and above its 200 Daily moving average @ 1.193
| Trends | Trends.1 | |
|---|---|---|
| 0 | Daily SMA20 | 1.2109 |
| 1 | Daily SMA50 | 1.2149 |
| 2 | Daily SMA100 | 1.1941 |
| 3 | Daily SMA200 | 1.1930 |
The previous day high was 1.2042 while the previous day low was 1.1928. The daily 38.2% Fib levels comes at 1.1972, expected to provide resistance. Similarly, the daily 61.8% fib level is at 1.1999, expected to provide resistance.
Note the levels of interest below:
- Pivot support is noted at 1.19, 1.1858, 1.1787
- Pivot resistance is noted at 1.2014, 1.2085, 1.2127
| Levels | Levels.1 |
|---|---|
| Previous Daily High | 1.2042 |
| Previous Daily Low | 1.1928 |
| Previous Weekly High | 1.2148 |
| Previous Weekly Low | 1.1928 |
| Previous Monthly High | 1.2448 |
| Previous Monthly Low | 1.1841 |
| Daily Fibonacci 38.2% | 1.1972 |
| Daily Fibonacci 61.8% | 1.1999 |
| Daily Pivot Point S1 | 1.1900 |
| Daily Pivot Point S2 | 1.1858 |
| Daily Pivot Point S3 | 1.1787 |
| Daily Pivot Point R1 | 1.2014 |
| Daily Pivot Point R2 | 1.2085 |
| Daily Pivot Point R3 | 1.2127 |
[/s2If]
Join Our Telegram Group
")


