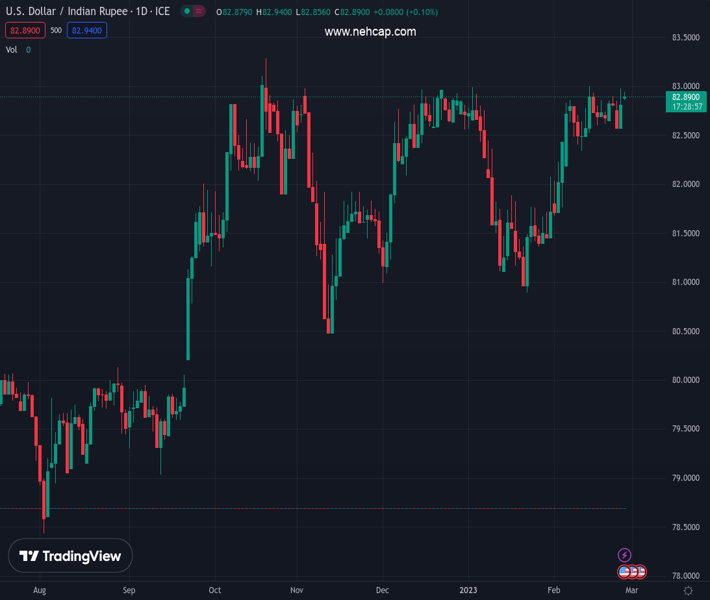
#USDINR @ 82.9180 struggles for clear directions after five-week uptrend, grinds higher of late. (Pivot Orderbook analysis)
…
This is a premium post.
[s2If !current_user_can(access_s2member_level4)]Please register for PREMIUM VERSION HERE to read full post below containing analysis. In case of any error or you think you are not able to read the full post below, please email us at support#nehcap.com [lwa][/s2If] [s2If current_user_can(access_s2member_level4)]
- USD/INR struggles for clear directions after five-week uptrend, grinds higher of late.
- Hawkish Fed concerns, upbeat US Treasury bond yields underpin US Dollar strength.
- RBI’s hawkish mood contrasts with fears of easy growth figures to weigh on Indian Rupee.
- US data, risk catalysts eyed for clear directions past India Q3 GDP.
The pair currently trades last at 82.9180.
The previous day high was 83.0256 while the previous day low was 82.6008. The daily 38.2% Fib levels comes at 82.8633, expected to provide support. Similarly, the daily 61.8% fib level is at 82.7631, expected to provide support.
USD/INR seesaws around 82.90 as bulls take a breather following a five-week winning streak during early Monday. In doing so, the Indian Rupee (INR) pair portrays the traders’ anxiety ahead of the key third quarter (Q3) Indian Gross Domestic Product (GDP) for the Fiscal Year 2023 (FY2023).
Despite the pre-data anxiety, the hopes of softer FY2023 Q3 GDP figures, 4.6% versus 6.3% prior, join the hawkish Federal Reserve (Fed) concerns to keep USD/INR buyers hopeful. That said, the Reserve Bank of India’s (RBI) readiness to tame inflation, even at the cost of higher rates, seems to challenge the Indian Rupee bears.
Even so, the strong US inflation clues join geopolitical fears surrounding China and Russia, as well as hawkish Fed concerns, to keep the USD/INR buyers hopeful. That said, the US Dollar Index (DXY) makes rounds to its intraday high of around 105.30 following the initial pullback from a seven-week high. In doing so, the greenback’s gauge versus the six major currencies remains firmer for the fifth consecutive day.
It’s worth observing that market bets for the Fed fund futures hint at the 5.30% interest rate for late 2023, versus the US central bank’s forecast of a near 5.10% peak rate.
Against this backdrop, the US 10-year Treasury yields reverse the early-day losses of around 3.95%. Further, the two-year counterparts jump back towards the highest levels since November 2022, marked the previous day, as bond bears poke the 4.83% level by the press time. Further, the S&P 500 Futures lick its wounds with mild gains after the Wall Street benchmark posted the biggest weekly slump of 2023.
Looking forward, a light calendar on Monday and the pre-data anxiety may restrict USD/INR moves.
A three-week-old rising wedge chart formation suggests a short-term upward grind of the USD/INR prices between 83.25 and 82.65.
Technical Levels: Supports and Resistances
USDINR currently trading at 82.902 at the time of writing. Pair opened at 82.8811 and is trading with a change of 0.03% % .
| Overview | Overview.1 | |
|---|---|---|
| 0 | Today last price | 82.902 |
| 1 | Today Daily Change | 0.0209 |
| 2 | Today Daily Change % | 0.03% |
| 3 | Today daily open | 82.8811 |
The pair remains strongly bullish on the daily timeframe. It trades above its 20 SMA @ 82.5336, 50 SMA 82.2699, 100 SMA @ 82.1514 and 200 SMA @ 80.7576.
| Trends | Trends.1 | |
|---|---|---|
| 0 | Daily SMA20 | 82.5336 |
| 1 | Daily SMA50 | 82.2699 |
| 2 | Daily SMA100 | 82.1514 |
| 3 | Daily SMA200 | 80.7576 |
The previous day high was 83.0256 while the previous day low was 82.6008. The daily 38.2% Fib levels comes at 82.8633, expected to provide support. Similarly, the daily 61.8% fib level is at 82.7631, expected to provide support.
Note the levels of interest below:
- Pivot support is noted at 82.6461, 82.4111, 82.2214
- Pivot resistance is noted at 83.0708, 83.2605, 83.4955
| Levels | Levels.1 |
|---|---|
| Previous Daily High | 83.0256 |
| Previous Daily Low | 82.6008 |
| Previous Weekly High | 83.0256 |
| Previous Weekly Low | 82.5615 |
| Previous Monthly High | 83.0720 |
| Previous Monthly Low | 80.8822 |
| Daily Fibonacci 38.2% | 82.8633 |
| Daily Fibonacci 61.8% | 82.7631 |
| Daily Pivot Point S1 | 82.6461 |
| Daily Pivot Point S2 | 82.4111 |
| Daily Pivot Point S3 | 82.2214 |
| Daily Pivot Point R1 | 83.0708 |
| Daily Pivot Point R2 | 83.2605 |
| Daily Pivot Point R3 | 83.4955 |
[/s2If]
Join Our Telegram Group
")


