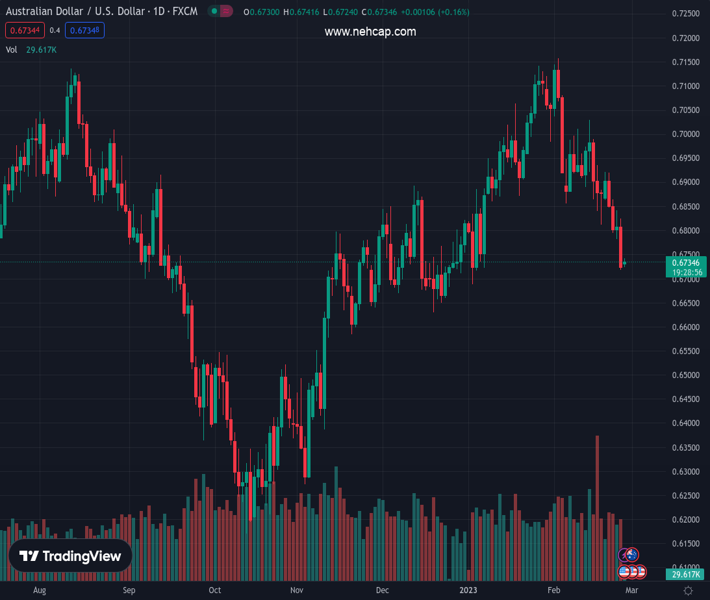
#AUDUSD @ 0.67347 prints mild gains around seven-week low, grinds near intraday high of late., @nehcap view: Limited recovery expected (Pivot Orderbook analysis)
…
This is a premium post.
[s2If !current_user_can(access_s2member_level4)]Please register for PREMIUM VERSION HERE to read full post below containing analysis. In case of any error or you think you are not able to read the full post below, please email us at support#nehcap.com [lwa][/s2If] [s2If current_user_can(access_s2member_level4)]
- AUD/USD prints mild gains around seven-week low, grinds near intraday high of late.
- Convergence of 100-DMA, three-month-old ascending support line restricts immediate downside amid nearly oversold RSI conditions.
- 200-DMA, three-week-old descending trend line challenge recovery moves amid bearish MACD signals.
The pair currently trades last at 0.67347.
The previous day high was 0.6824 while the previous day low was 0.6719. The daily 38.2% Fib levels comes at 0.6759, expected to provide resistance. Similarly, the daily 61.8% fib level is at 0.6784, expected to provide resistance.
AUD/USD licks its wounds while printing mild gains around 0.6735-40, bouncing off a seven-week low during early Monday’s sluggish session.
In doing so, the Aussie pair rebounds from a convergence of the 100-DMA and an upward-sloping support line from late November 2022. The corrective move also justifies the nearly oversold RSI (14).
However, the recovery remains elusive unless providing a daily closing beyond the 200-DMA hurdle of 0.6800.
Following that, a downward-sloping resistance line from February 02, close to 0.6850 at the latest, acts as the last defense of the AUD/USD bears, a break of which could propel prices towards the 0.7000 round figure.
Should the Aussie pair buyers keep the reins past 0.7000, tops marked during the mid-February, as well as the monthly high, surrounding 0.7030 and 0.7160 in that order, could lure the upside momentum.
Meanwhile, a daily closing below 0.6730 could quickly drag AUD/USD toward a late December 2022 low near 0.6630. However, lows marked during November 21 and 11, around 0.6585 and 0.6575 could challenge the bears afterward.
Overall, AUD/USD is likely to witness further downside unless marking a sustained break of 0.6850.
Trend: Limited recovery expected
Technical Levels: Supports and Resistances
AUDUSD currently trading at 0.6734 at the time of writing. Pair opened at 0.6727 and is trading with a change of 0.10% % .
| Overview | Overview.1 | |
|---|---|---|
| 0 | Today last price | 0.6734 |
| 1 | Today Daily Change | 0.0007 |
| 2 | Today Daily Change % | 0.10% |
| 3 | Today daily open | 0.6727 |
The pair is trading below its 20 Daily moving average @ 0.693, below its 50 Daily moving average @ 0.6893 , above its 100 Daily moving average @ 0.6726 and below its 200 Daily moving average @ 0.6801
| Trends | Trends.1 | |
|---|---|---|
| 0 | Daily SMA20 | 0.6930 |
| 1 | Daily SMA50 | 0.6893 |
| 2 | Daily SMA100 | 0.6726 |
| 3 | Daily SMA200 | 0.6801 |
The previous day high was 0.6824 while the previous day low was 0.6719. The daily 38.2% Fib levels comes at 0.6759, expected to provide resistance. Similarly, the daily 61.8% fib level is at 0.6784, expected to provide resistance.
Note the levels of interest below:
- Pivot support is noted at 0.6689, 0.6651, 0.6584
- Pivot resistance is noted at 0.6795, 0.6862, 0.69
| Levels | Levels.1 |
|---|---|
| Previous Daily High | 0.6824 |
| Previous Daily Low | 0.6719 |
| Previous Weekly High | 0.6921 |
| Previous Weekly Low | 0.6719 |
| Previous Monthly High | 0.7143 |
| Previous Monthly Low | 0.6688 |
| Daily Fibonacci 38.2% | 0.6759 |
| Daily Fibonacci 61.8% | 0.6784 |
| Daily Pivot Point S1 | 0.6689 |
| Daily Pivot Point S2 | 0.6651 |
| Daily Pivot Point S3 | 0.6584 |
| Daily Pivot Point R1 | 0.6795 |
| Daily Pivot Point R2 | 0.6862 |
| Daily Pivot Point R3 | 0.6900 |
[/s2If]
Join Our Telegram Group
")


