#USDCAD @ 1.35936 stays pressured around intraday low after reversing from multi-day high., @nehcap view: Limited downside expected (Pivot Orderbook analysis)
…
This is a premium post.
[s2If !current_user_can(access_s2member_level4)]Please register for PREMIUM VERSION HERE to read full post below containing analysis. In case of any error or you think you are not able to read the full post below, please email us at support#nehcap.com [lwa][/s2If] [s2If current_user_can(access_s2member_level4)]
- USD/CAD stays pressured around intraday low after reversing from multi-day high.
- RSI pullback favors latest retreat in Loonie prices toward two-week-old ascending support line.
- Bullish MACD signals, hawkish fundamentals challenge downside bias.
- Buyers have a bumpy road to witness on their return.
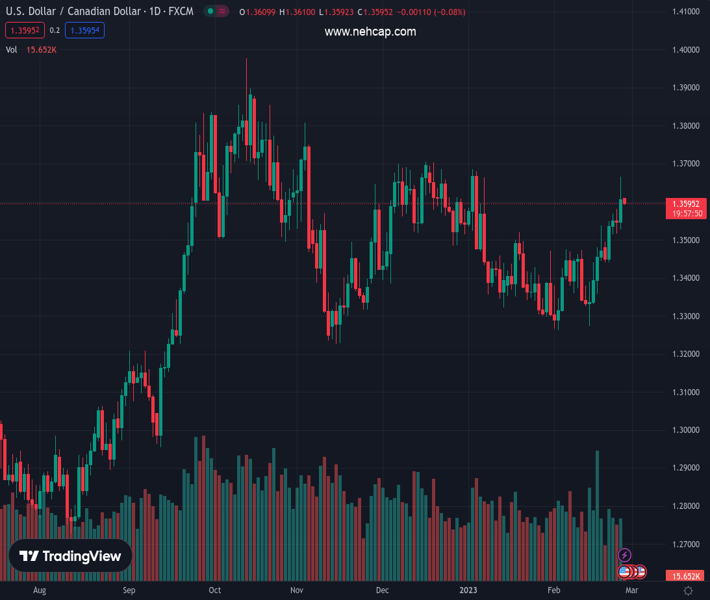
The pair currently trades last at 1.35936.
The previous day high was 1.3666 while the previous day low was 1.3527. The daily 38.2% Fib levels comes at 1.3613, expected to provide resistance. Similarly, the daily 61.8% fib level is at 1.358, expected to provide support.
USD/CAD holds lower grounds near the intraday bottom surrounding 1.3590 during the mid-Asian session on Monday, extending the previous day’s U-turn from a seven-week high.
The Loonie pair’s latest weakness could be linked to the overbought conditions of the RSI (14), as well as a failure to provide a daily closing beyond the January 06 swing high. The pullback moves also took clues from the downside break of the two-week-old previous resistance line.
However, bullish MACD signals and an upward-sloping support line from February 14, close to 1.3570 by the press time, challenges the USD/CAD bears.
If the Loonie pair bears manage to conquer the stated support, the odds of witnessing a quick slump towards the 61.8% Fibonacci retracement level of the pair’s moves from the mid-December 2022 to early February, around 1.3535, can’t be ruled out.
Though, the late January swing high near 1.3520 and multiple tops marked during late January and early February, near 1.3480-70, could probe the USD/CAD sellers afterward.
Meanwhile, the upward-sloping resistance line from February 09, close to 1.3620 at the latest, guards the USD/CAD pair’s immediate upside.
Following that, horizontal lines comprising tops marked since early January and late December 2022, respectively near 1.3665 and 1.3685, becomes crucial for the bulls to watch for clear directions.
Trend: Limited downside expected
Technical Levels: Supports and Resistances
USDCAD currently trading at 1.36 at the time of writing. Pair opened at 1.3606 and is trading with a change of -0.04% % .
| Overview | Overview.1 | |
|---|---|---|
| 0 | Today last price | 1.36 |
| 1 | Today Daily Change | -0.0006 |
| 2 | Today Daily Change % | -0.04% |
| 3 | Today daily open | 1.3606 |
The pair remains strongly bullish on the daily timeframe. It trades above its 20 SMA @ 1.3424, 50 SMA 1.3462, 100 SMA @ 1.3512 and 200 SMA @ 1.3264.
| Trends | Trends.1 | |
|---|---|---|
| 0 | Daily SMA20 | 1.3424 |
| 1 | Daily SMA50 | 1.3462 |
| 2 | Daily SMA100 | 1.3512 |
| 3 | Daily SMA200 | 1.3264 |
The previous day high was 1.3666 while the previous day low was 1.3527. The daily 38.2% Fib levels comes at 1.3613, expected to provide resistance. Similarly, the daily 61.8% fib level is at 1.358, expected to provide support.
Note the levels of interest below:
- Pivot support is noted at 1.3534, 1.3462, 1.3396
- Pivot resistance is noted at 1.3672, 1.3738, 1.381
| Levels | Levels.1 |
|---|---|
| Previous Daily High | 1.3666 |
| Previous Daily Low | 1.3527 |
| Previous Weekly High | 1.3666 |
| Previous Weekly Low | 1.3441 |
| Previous Monthly High | 1.3685 |
| Previous Monthly Low | 1.3300 |
| Daily Fibonacci 38.2% | 1.3613 |
| Daily Fibonacci 61.8% | 1.3580 |
| Daily Pivot Point S1 | 1.3534 |
| Daily Pivot Point S2 | 1.3462 |
| Daily Pivot Point S3 | 1.3396 |
| Daily Pivot Point R1 | 1.3672 |
| Daily Pivot Point R2 | 1.3738 |
| Daily Pivot Point R3 | 1.3810 |
[/s2If]
Join Our Telegram Group
")


