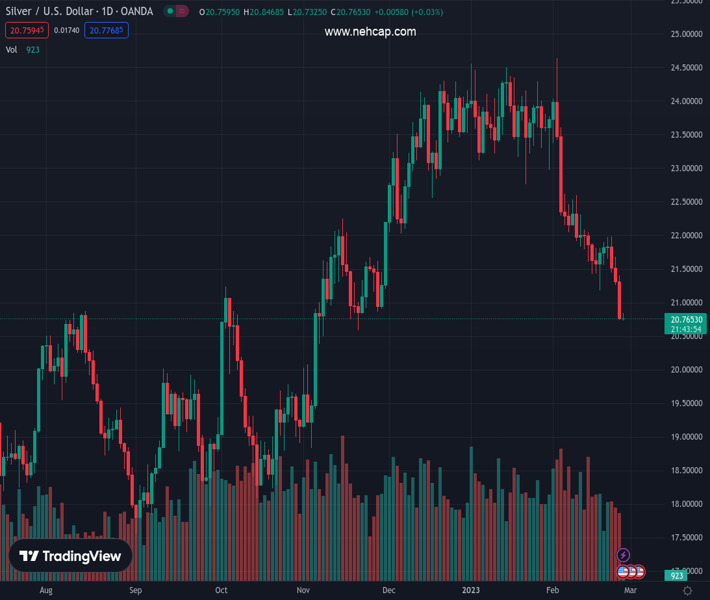
#XAGUSD @ 20.758 Silver price remains pressured at the lowest levels in three months., @nehcap view: Further downside expected (Pivot Orderbook analysis)
…
This is a premium post.
[s2If !current_user_can(access_s2member_level4)]Please register for PREMIUM VERSION HERE to read full post below containing analysis. In case of any error or you think you are not able to read the full post below, please email us at support#nehcap.com [lwa][/s2If] [s2If current_user_can(access_s2member_level4)]
- Silver price remains pressured at the lowest levels in three months.
- RSI conditions limit immediate downside near three-week-old descending trend line.
- Descending megaphone formation suggests more volatility towards the south.
- Recovery remains elusive unless crossing 100-SMA.
The pair currently trades last at 20.758.
The previous day high was 21.4 while the previous day low was 20.74. The daily 38.2% Fib levels comes at 20.99, expected to provide resistance. Similarly, the daily 61.8% fib level is at 21.15, expected to provide resistance.
Silver price (XAG/USD) takes offers to reverse the week-start corrective bounce off the three-month low during the mid-Asian session on Monday. In doing so, the bright metal pokes the key $20.75-70 zone, the lowest since late November 2022, as oversold RSI (14) probes the quote’s further downside.
However, a downward-sloping megaphone trend-widening chart formation, established since early February, joins the bearish MACD signals to keep XAG/USD sellers hopeful.
That said, the bullion’s further downside could aim for the November 21, 2022 swing low of $20.58 before challenging the stated megaphone’s lower line, close to $20.55 at the latest.
Though, the RSI conditions and the aforementioned $20.55 trend line support may restrict the commodity’s further downside.
Alternatively, a three-day-old descending resistance line, near $21.00, restricts immediate recovery moves of the Silver price.
Following that, the stated megaphone’s top line, around $21.80 by the press time, could challenge the XAG/USD buyers.
It’s worth noting, however, that the metal’s upside remains doubtful unless crossing the 100-SMA level surrounding $21.90.
Also acting as an upside filter is the previous weekly top of near $22.00, a break of which could direct the buyers towards the November 2022 high of $22.25.
Overall, Silver price remains bearish but the downside appears limited amid oversold RSI conditions.
Trend: Further downside expected
Technical Levels: Supports and Resistances
XAGUSD currently trading at 20.78 at the time of writing. Pair opened at 20.76 and is trading with a change of 0.10% % .
| Overview | Overview.1 | |
|---|---|---|
| 0 | Today last price | 20.78 |
| 1 | Today Daily Change | 0.02 |
| 2 | Today Daily Change % | 0.10% |
| 3 | Today daily open | 20.76 |
The pair remains strongly bearish on the daily time frame. It trades below the 20 SMA @ 22.2, 50 SMA 23.14, 100 SMA @ 22.02 and 200 SMA @ 21.01.
| Trends | Trends.1 | |
|---|---|---|
| 0 | Daily SMA20 | 22.20 |
| 1 | Daily SMA50 | 23.14 |
| 2 | Daily SMA100 | 22.02 |
| 3 | Daily SMA200 | 21.01 |
The previous day high was 21.4 while the previous day low was 20.74. The daily 38.2% Fib levels comes at 20.99, expected to provide resistance. Similarly, the daily 61.8% fib level is at 21.15, expected to provide resistance.
Note the levels of interest below:
- Pivot support is noted at 20.53, 20.31, 19.87
- Pivot resistance is noted at 21.2, 21.63, 21.86
| Levels | Levels.1 |
|---|---|
| Previous Daily High | 21.40 |
| Previous Daily Low | 20.74 |
| Previous Weekly High | 21.98 |
| Previous Weekly Low | 20.74 |
| Previous Monthly High | 24.55 |
| Previous Monthly Low | 22.76 |
| Daily Fibonacci 38.2% | 20.99 |
| Daily Fibonacci 61.8% | 21.15 |
| Daily Pivot Point S1 | 20.53 |
| Daily Pivot Point S2 | 20.31 |
| Daily Pivot Point S3 | 19.87 |
| Daily Pivot Point R1 | 21.20 |
| Daily Pivot Point R2 | 21.63 |
| Daily Pivot Point R3 | 21.86 |
[/s2If]
Join Our Telegram Group
")


