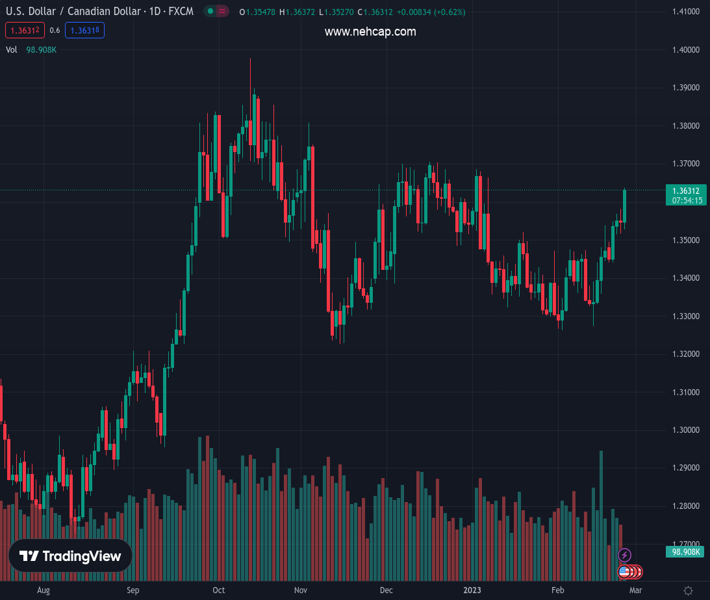
#USDCAD @ 1.36233 catches aggressive bids on Friday and hits a fresh high since January. (Pivot Orderbook analysis)
…
This is a premium post.
[s2If !current_user_can(access_s2member_level4)]Please register for PREMIUM VERSION HERE to read full post below containing analysis. In case of any error or you think you are not able to read the full post below, please email us at support#nehcap.com [lwa][/s2If] [s2If current_user_can(access_s2member_level4)]
- USD/CAD catches aggressive bids on Friday and hits a fresh high since January.
- Sustained USD buying turns out to be a key factor fueling the strong move up.
- Investors now await the US Core PCE Price Index for some meaningful impetus.
The pair currently trades last at 1.36233.
The previous day high was 1.3581 while the previous day low was 1.3516. The daily 38.2% Fib levels comes at 1.3541, expected to provide support. Similarly, the daily 61.8% fib level is at 1.3557, expected to provide support.
The USD/CAD pair regains positive traction on Friday and jumps to the 1.3600 mark, or a fresh high since January heading into the North American session. The strong intraday bullish move follows the previous day’s good two-way price swings and is sponsored by sustained US Dollar buying.
In fact, the USD Index, which tracks the Greenback against a basket of currencies, climbs to a fresh multi-week high and continues to draw support from hawkish Fed expectations. In fact, the markets seem convinced that the US central bank will stick to its hawkish stance for longer. The bets were lifted by the FOMC minutes released on Wednesday, which revealed that officials were determined to raise interest rates further to fully gain control over inflation.
Moreover, the recent upbeat US economic data points to an economy that remains resilient despite rising borrowing costs and supports prospects for further policy tightening by the Fed. This remains supportive of elevated US Treasury bond yields, which, along with a weaker risk tone, seem to boost the safe-haven USD. Apart from this, an intraday pullback in Crude Oil prices undermines the commodity-linked Loonie and acts as a tailwind for the USD/CAD pair.
Worries that rapidly rising interest rates will dampen economic growth and dent fuel demand keep a lid on any meaningful gains for the black liquid. Furthermore, softer Canadian consumer inflation figures released earlier this week fueled speculations that the Bank of Canada will pause the policy-tightening cycle. This, along with the recent break through key technical hurdles, suggests that the path of least resistance for the USD/CAD pair is to the upside.
Next on tap is the release of the US Core PCE Price Index – the Fed’s preferred inflation gauge. The data should influence market expectations about the Fed’s future rate hike path. This, in turn, will play a key role in driving the USD demand in the near term. Apart from this, Oil price dynamics should provide some meaningful impetus to the USD/CAD pair. Nevertheless, spot prices remain on track to register strong gains for the second successive week.
Technical Levels: Supports and Resistances
USDCAD currently trading at 1.3597 at the time of writing. Pair opened at 1.3543 and is trading with a change of 0.4 % .
| Overview | Overview.1 | |
|---|---|---|
| 0 | Today last price | 1.3597 |
| 1 | Today Daily Change | 0.0054 |
| 2 | Today Daily Change % | 0.4000 |
| 3 | Today daily open | 1.3543 |
The pair remains strongly bullish on the daily timeframe. It trades above its 20 SMA @ 1.341, 50 SMA 1.3463, 100 SMA @ 1.3513 and 200 SMA @ 1.326.
| Trends | Trends.1 | |
|---|---|---|
| 0 | Daily SMA20 | 1.3410 |
| 1 | Daily SMA50 | 1.3463 |
| 2 | Daily SMA100 | 1.3513 |
| 3 | Daily SMA200 | 1.3260 |
The previous day high was 1.3581 while the previous day low was 1.3516. The daily 38.2% Fib levels comes at 1.3541, expected to provide support. Similarly, the daily 61.8% fib level is at 1.3557, expected to provide support.
Note the levels of interest below:
- Pivot support is noted at 1.3512, 1.3482, 1.3447
- Pivot resistance is noted at 1.3577, 1.3612, 1.3642
| Levels | Levels.1 |
|---|---|
| Previous Daily High | 1.3581 |
| Previous Daily Low | 1.3516 |
| Previous Weekly High | 1.3538 |
| Previous Weekly Low | 1.3274 |
| Previous Monthly High | 1.3685 |
| Previous Monthly Low | 1.3300 |
| Daily Fibonacci 38.2% | 1.3541 |
| Daily Fibonacci 61.8% | 1.3557 |
| Daily Pivot Point S1 | 1.3512 |
| Daily Pivot Point S2 | 1.3482 |
| Daily Pivot Point S3 | 1.3447 |
| Daily Pivot Point R1 | 1.3577 |
| Daily Pivot Point R2 | 1.3612 |
| Daily Pivot Point R3 | 1.3642 |
[/s2If]
Join Our Telegram Group
")


