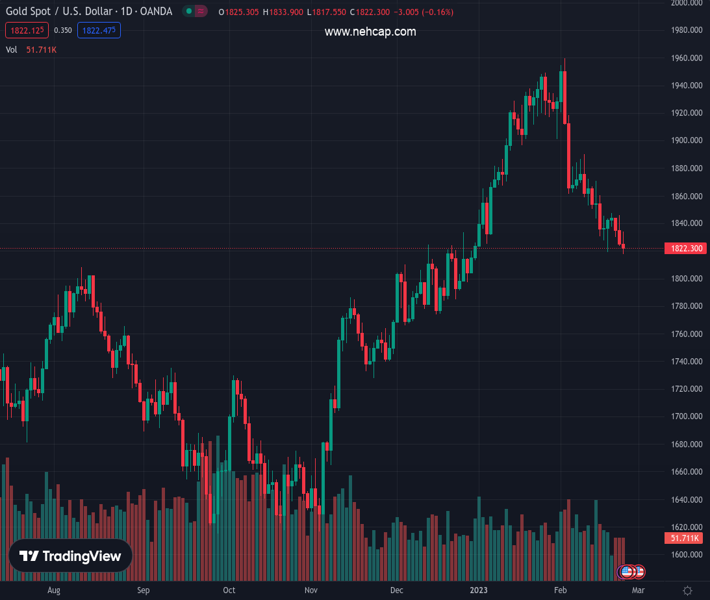
#XAUUSD @ 1,822.16 Gold price is exposed for further downside to near $1,800.00 amid hawkish Fed bets. (Pivot Orderbook analysis)
…
This is a premium post.
[s2If !current_user_can(access_s2member_level4)]Please register for PREMIUM VERSION HERE to read full post below containing analysis. In case of any error or you think you are not able to read the full post below, please email us at support#nehcap.com [lwa][/s2If] [s2If current_user_can(access_s2member_level4)]
- Gold price is exposed for further downside to near $1,800.00 amid hawkish Fed bets.
- The USD Index is showing signs of reversal as the Fed is expected to continue its policy tightening.
- Gold price has comfortably shifted below the 38.2% Fibonacci retracement at $1,829.45.
The pair currently trades last at 1822.16.
The previous day high was 1846.11 while the previous day low was 1823.63. The daily 38.2% Fib levels comes at 1832.22, expected to provide resistance. Similarly, the daily 61.8% fib level is at 1837.52, expected to provide resistance.
Gold price (XAU/USD) has printed a fresh seven-week low of $1,819.00 as the Federal Reserve (Fed) policymakers are favoring reaching the terminal rate as early as possible. The reason behind quickly accessing the terminal rate is the upbeat labor market in the United States, which could underpin the Consumer Price Index (CPI) sooner.
The US Dollar Index (DXY) is showing signs of reversal after a corrective move to near 104.15 as the Fed is expected to continue its policy tightening spell to achieve price stability. This has exposed the Gold price to continue its downside momentum to near the round-level support of $1.800.00.
S&P500 futures recovered on Thursday as investors believe that the US economy is not exposed to recession fears as the economic outlook is steady amid stellar retail demand and robust labor need. Contrary to that, the 10-year US Treasury yields dropped below 3.90%.
On Thursday, the number of people filing for jobless claims for the first time dropped to 192K vs. the consensus of 200K. This has signaled again that the labor market is extremely tight and consumer spending will remain robust ahead.
Economists at TD Securities expect 25 bps rate hikes in March and May, with the Fed settling on a terminal Fed funds target rate range of 5.00%-5.25% by May. And, Fed chair Jerome Powell will keep higher rates for a longer period.
Gold price has comfortably shifted below the 38.2% Fibonacci retracement (placed from November 3 low at $1,616.69 to February 2 high at $1.959.71) at $1,829.45 on a four-hour scale. The precious metal is expected to display more weakness below the immediate support at $1,819.00.
The 50-period Exponential Moving Average (EMA) at $1,840.00 is acting as resistance for the Gold price.
Meanwhile, the Relative Strength Index (RSI) (14) has shifted into the bearish range of 20.00-40.00, which indicates more weakness ahead.
Technical Levels: Supports and Resistances
XAUUSD currently trading at 1822.31 at the time of writing. Pair opened at 1824.86 and is trading with a change of -0.14 % .
| Overview | Overview.1 | |
|---|---|---|
| 0 | Today last price | 1822.31 |
| 1 | Today Daily Change | -2.55 |
| 2 | Today Daily Change % | -0.14 |
| 3 | Today daily open | 1824.86 |
The pair is trading below its 20 Daily moving average @ 1875.26, below its 50 Daily moving average @ 1864.05 , above its 100 Daily moving average @ 1790.08 and above its 200 Daily moving average @ 1776.28
| Trends | Trends.1 | |
|---|---|---|
| 0 | Daily SMA20 | 1875.26 |
| 1 | Daily SMA50 | 1864.05 |
| 2 | Daily SMA100 | 1790.08 |
| 3 | Daily SMA200 | 1776.28 |
The previous day high was 1846.11 while the previous day low was 1823.63. The daily 38.2% Fib levels comes at 1832.22, expected to provide resistance. Similarly, the daily 61.8% fib level is at 1837.52, expected to provide resistance.
Note the levels of interest below:
- Pivot support is noted at 1816.96, 1809.05, 1794.48
- Pivot resistance is noted at 1839.44, 1854.01, 1861.92
| Levels | Levels.1 |
|---|---|
| Previous Daily High | 1846.11 |
| Previous Daily Low | 1823.63 |
| Previous Weekly High | 1870.71 |
| Previous Weekly Low | 1818.93 |
| Previous Monthly High | 1949.27 |
| Previous Monthly Low | 1823.76 |
| Daily Fibonacci 38.2% | 1832.22 |
| Daily Fibonacci 61.8% | 1837.52 |
| Daily Pivot Point S1 | 1816.96 |
| Daily Pivot Point S2 | 1809.05 |
| Daily Pivot Point S3 | 1794.48 |
| Daily Pivot Point R1 | 1839.44 |
| Daily Pivot Point R2 | 1854.01 |
| Daily Pivot Point R3 | 1861.92 |
[/s2If]
Join Our Telegram Group
")


